6356 Jason Ln Unit 38 Dayton, OH 45459
Estimated Value: $153,000 - $172,000
2
Beds
1
Bath
912
Sq Ft
$175/Sq Ft
Est. Value
About This Home
This home is located at 6356 Jason Ln Unit 38, Dayton, OH 45459 and is currently estimated at $159,298, approximately $174 per square foot. 6356 Jason Ln Unit 38 is a home located in Montgomery County with nearby schools including Primary Village North, Driscoll Elementary School, and Tower Heights Middle School.
Ownership History
Date
Name
Owned For
Owner Type
Purchase Details
Closed on
Nov 2, 2018
Sold by
Livingston Betty B
Bought by
Livingston Alan G and Livingston Julie C
Current Estimated Value
Home Financials for this Owner
Home Financials are based on the most recent Mortgage that was taken out on this home.
Original Mortgage
$78,850
Outstanding Balance
$69,048
Interest Rate
4.6%
Mortgage Type
New Conventional
Estimated Equity
$90,250
Purchase Details
Closed on
May 4, 2007
Sold by
Hatcher Patricia A and Estate Of Lee Roy L Dice
Bought by
Livingston Betty B
Purchase Details
Closed on
Sep 10, 2003
Sold by
Moorman Francis J and Moorman Pamela
Bought by
Dice Lee Roy Link
Home Financials for this Owner
Home Financials are based on the most recent Mortgage that was taken out on this home.
Original Mortgage
$36,000
Interest Rate
6.33%
Mortgage Type
Purchase Money Mortgage
Purchase Details
Closed on
Jun 14, 1994
Sold by
Paris Faye B
Bought by
Moorman Francis J
Create a Home Valuation Report for This Property
The Home Valuation Report is an in-depth analysis detailing your home's value as well as a comparison with similar homes in the area
Home Values in the Area
Average Home Value in this Area
Purchase History
| Date | Buyer | Sale Price | Title Company |
|---|---|---|---|
| Livingston Alan G | $83,000 | Home Services Title Llc | |
| Livingston Betty B | $85,000 | Attorney | |
| Dice Lee Roy Link | $76,000 | Hallmark Title | |
| Moorman Francis J | -- | -- |
Source: Public Records
Mortgage History
| Date | Status | Borrower | Loan Amount |
|---|---|---|---|
| Open | Livingston Alan G | $78,850 | |
| Previous Owner | Dice Lee Roy Link | $36,000 |
Source: Public Records
Tax History Compared to Growth
Tax History
| Year | Tax Paid | Tax Assessment Tax Assessment Total Assessment is a certain percentage of the fair market value that is determined by local assessors to be the total taxable value of land and additions on the property. | Land | Improvement |
|---|---|---|---|---|
| 2024 | $2,423 | $41,520 | $9,940 | $31,580 |
| 2023 | $2,423 | $41,520 | $9,940 | $31,580 |
| 2022 | $2,154 | $29,240 | $7,000 | $22,240 |
| 2021 | $2,160 | $29,240 | $7,000 | $22,240 |
| 2020 | $2,168 | $29,240 | $7,000 | $22,240 |
| 2019 | $2,245 | $27,020 | $7,000 | $20,020 |
| 2018 | $2,028 | $27,020 | $7,000 | $20,020 |
| 2017 | $2,007 | $27,020 | $7,000 | $20,020 |
| 2016 | $1,077 | $22,650 | $7,000 | $15,650 |
| 2015 | $1,066 | $22,650 | $7,000 | $15,650 |
| 2014 | $1,066 | $22,650 | $7,000 | $15,650 |
| 2012 | -- | $25,410 | $7,000 | $18,410 |
Source: Public Records
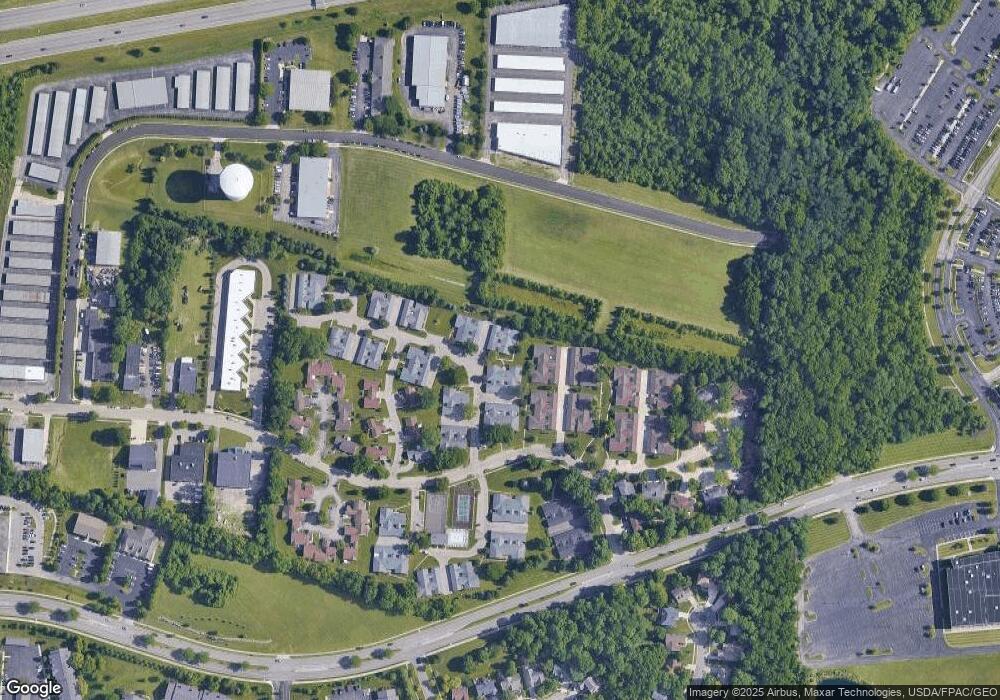
Map
Nearby Homes
- 6350 Gwinnett Ln Unit 1326
- 1973 Home Path Ct
- 6650 Wareham Ct Unit 5
- 1740 Piper Ln
- 1820 Piper Ln Unit 103
- 1770 Piper Ln Unit 208
- 1511 Lake Pointe Way Unit 6
- 1511 Lake Pointe Way
- 1511 Lake Pointe Way Unit 2
- 6610 Green Branch Dr
- 2278 Millwood Rd
- 1462 Carriage Trace Blvd Unit 215
- 6102 Singletree Ln
- 1311 Hollow Run Unit 11
- 1311 Hollow Run Unit 6
- 6046 N Quinella Way Unit 51246
- 1457 Carriage Trace Blvd Unit 4
- 1310 Hollow Run Unit 3
- 5710 Coach Dr W Unit E
- 5685 Coach Dr E Unit D
- 6352 Jason Ln Unit 1639
- 6348 Jason Ln
- 6346 Jason Ln Unit 42
- 6372 Jason Ln Unit 36
- 6366 Jason Ln Unit 35
- 6362 Jason Ln Unit 1534
- 6340 Jason Ln Unit 4117
- 6375 Zach Place Unit 35104
- 6379 Zach Place Unit 35105
- 6383 Zach Place Unit 35106
- 6385 Jason Ln Unit 64
- 6392 Jason Ln Unit 1431
- 6386 Jason Ln Unit 32
- 6398 Jason Ln Unit 1430
- 6379 Jason Ln Unit 65
- 6382 Jason Ln
- 6387 Zach Place Unit 343499
- 6367 Jason Ln
- 6391 Zach Place Unit 3434100
- 6363 Jason Ln Unit 2360