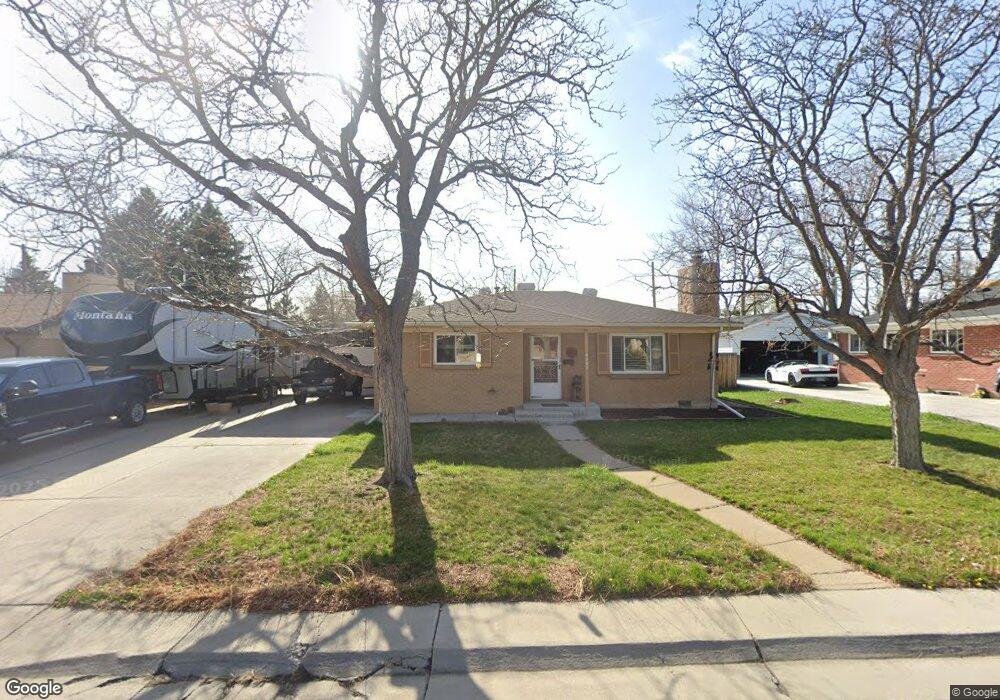
6357 Ingalls Ct Arvada, CO 80003
Lamar Heights NeighborhoodEstimated Value: $424,000 - $457,194
2
Beds
1
Bath
975
Sq Ft
$449/Sq Ft
Est. Value
About This Home
This home is located at 6357 Ingalls Ct, Arvada, CO 80003 and is currently estimated at $437,299, approximately $448 per square foot. 6357 Ingalls Ct is a home located in Jefferson County with nearby schools including Swanson Elementary School, North Arvada Middle School, and Arvada High School.
Ownership History
Date
Name
Owned For
Owner Type
Purchase Details
Closed on
Feb 15, 2001
Sold by
Montoya Thomas A
Bought by
Lebsack Mary Ann
Current Estimated Value
Home Financials for this Owner
Home Financials are based on the most recent Mortgage that was taken out on this home.
Original Mortgage
$123,750
Outstanding Balance
$44,566
Interest Rate
7.04%
Estimated Equity
$392,733
Purchase Details
Closed on
Dec 20, 1996
Sold by
Evans Mark J
Bought by
Montoya Thomas A
Home Financials for this Owner
Home Financials are based on the most recent Mortgage that was taken out on this home.
Original Mortgage
$101,070
Interest Rate
7.6%
Mortgage Type
FHA
Create a Home Valuation Report for This Property
The Home Valuation Report is an in-depth analysis detailing your home's value as well as a comparison with similar homes in the area
Home Values in the Area
Average Home Value in this Area
Purchase History
| Date | Buyer | Sale Price | Title Company |
|---|---|---|---|
| Lebsack Mary Ann | $165,000 | -- | |
| Montoya Thomas A | $101,750 | -- |
Source: Public Records
Mortgage History
| Date | Status | Borrower | Loan Amount |
|---|---|---|---|
| Open | Lebsack Mary Ann | $123,750 | |
| Previous Owner | Montoya Thomas A | $101,070 |
Source: Public Records
Tax History
| Year | Tax Paid | Tax Assessment Tax Assessment Total Assessment is a certain percentage of the fair market value that is determined by local assessors to be the total taxable value of land and additions on the property. | Land | Improvement |
|---|---|---|---|---|
| 2024 | $2,063 | $27,971 | $14,654 | $13,317 |
| 2023 | $2,063 | $27,971 | $14,654 | $13,317 |
| 2022 | $1,660 | $23,903 | $12,600 | $11,303 |
| 2021 | $1,688 | $24,591 | $12,962 | $11,629 |
| 2020 | $1,417 | $21,831 | $8,505 | $13,326 |
| 2019 | $1,398 | $21,831 | $8,505 | $13,326 |
| 2018 | $1,126 | $18,697 | $5,744 | $12,953 |
| 2017 | $1,031 | $18,697 | $5,744 | $12,953 |
| 2016 | $742 | $15,587 | $5,645 | $9,942 |
| 2015 | $596 | $15,587 | $5,645 | $9,942 |
| 2014 | $596 | $11,781 | $4,872 | $6,909 |
Source: Public Records
Map
Nearby Homes
- 6462 Harlan St
- 6177 W 65th Ave
- 6503 Gray St
- 5687 W 65th Ave
- 6353 Depew St
- 6610 Depew Ct
- 6761 Harlan St
- 6650 Depew Ct
- 6404 Benton St
- 6172 W 68th Ave
- 6955 W 62nd Ave
- 5701 W 60th Ave
- 6480 W 60th Ave
- 6277 Reed Ct
- 6990 W 61st Ave
- 6840 W 60th Ave
- 6788 Pierce Way
- 5495 W 60th Ave
- 6185 Sheridan Blvd
- 6245 Saulsbury St
Your Personal Tour Guide
Ask me questions while you tour the home.