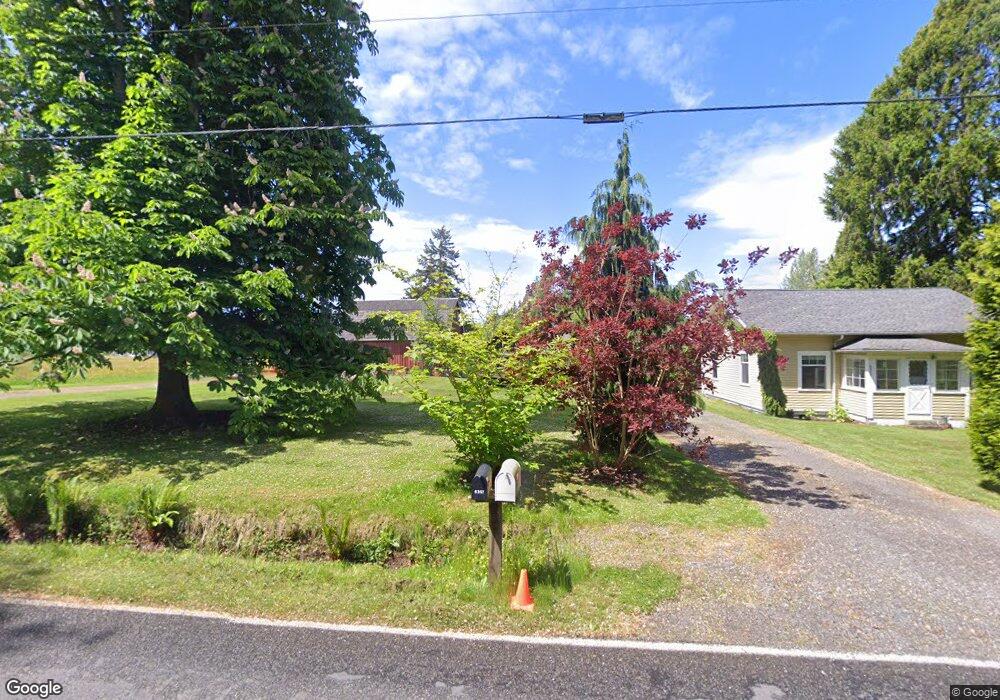
6357 N Star Rd Ferndale, WA 98248
Estimated Value: $924,879 - $926,000
3
Beds
1
Bath
988
Sq Ft
$937/Sq Ft
Est. Value
About This Home
This home is located at 6357 N Star Rd, Ferndale, WA 98248 and is currently estimated at $925,440, approximately $936 per square foot. 6357 N Star Rd is a home located in Whatcom County with nearby schools including Eagleridge Elementary School, Horizon Middle School, and Ferndale High School.
Ownership History
Date
Name
Owned For
Owner Type
Purchase Details
Closed on
Aug 6, 2021
Sold by
Jeff Sprecher
Bought by
Sprecher Jeff and Sprecher Judy
Current Estimated Value
Home Financials for this Owner
Home Financials are based on the most recent Mortgage that was taken out on this home.
Original Mortgage
$320,000
Interest Rate
2.34%
Mortgage Type
New Conventional
Purchase Details
Closed on
Apr 1, 2020
Sold by
Flannery Lowry Susan
Bought by
Saville Patty and Flannery Jordan
Purchase Details
Closed on
Sep 12, 2017
Sold by
Sprecher Jeff A
Bought by
Sprecher Jeff and Jeff Sprecher Living Trust
Purchase Details
Closed on
Apr 30, 2015
Sold by
Sprecher Sally
Bought by
Sprecher Jeff A
Create a Home Valuation Report for This Property
The Home Valuation Report is an in-depth analysis detailing your home's value as well as a comparison with similar homes in the area
Home Values in the Area
Average Home Value in this Area
Purchase History
| Date | Buyer | Sale Price | Title Company |
|---|---|---|---|
| Sprecher Jeff | $313 | None Listed On Document | |
| Sprecher Jeff | -- | Servicelink | |
| Sprecher Jeff | -- | Servicelink | |
| Saville Patty | $10,000 | Chicago Title | |
| Sprecher Jeff | -- | None Available | |
| Sprecher Jeff A | -- | None Available |
Source: Public Records
Mortgage History
| Date | Status | Borrower | Loan Amount |
|---|---|---|---|
| Previous Owner | Sprecher Jeff | $320,000 |
Source: Public Records
Tax History Compared to Growth
Tax History
| Year | Tax Paid | Tax Assessment Tax Assessment Total Assessment is a certain percentage of the fair market value that is determined by local assessors to be the total taxable value of land and additions on the property. | Land | Improvement |
|---|---|---|---|---|
| 2024 | $2,888 | $714,256 | $402,792 | $311,464 |
| 2023 | $2,888 | $714,256 | $402,792 | $311,464 |
| 2022 | $2,010 | $555,991 | $359,636 | $196,355 |
| 2021 | $1,887 | $459,503 | $303,622 | $155,881 |
| 2020 | $1,917 | $158,903 | $26,800 | $132,103 |
| 2019 | $1,610 | $358,896 | $237,145 | $121,751 |
| 2018 | $1,835 | $138,150 | $23,300 | $114,850 |
| 2017 | $1,753 | $118,584 | $20,000 | $98,584 |
| 2016 | $1,316 | $121,330 | $20,000 | $101,330 |
| 2015 | -- | $84,469 | $18,600 | $65,869 |
| 2014 | -- | $101,893 | $36,024 | $65,869 |
| 2013 | -- | $100,560 | $34,691 | $65,869 |
Source: Public Records
Map
Nearby Homes
- 6379 Elder Rd
- 6152 Garrett Ln
- 3324 Bailey Way
- 6241 Olson Rd
- 0 XX Olson Rd
- 6729 Hawk Ridge Dr
- 2751 Aldergrove Rd
- 0 Grandview Rd Unit NWM2386341
- 6072 Monument Dr
- 2780 Jenjar Ave
- 6041 Brian Ct
- 6038 Brian Ct
- 2646 Lochcarron Dr
- 3883 Everett Ln
- 0 Valley View Lot 2 Rd Unit NWM2208210
- 5856 W 26th Crest
- 5877 W 26th Crest
- 5958 W 26th Crest
- 5979 W 26th Crest
- 2632 (Lot 13) Sievers Way
- 6354 N Star Rd
- 6381 N Star Rd
- 6389 N Star Rd
- 6340 N Star Rd
- 6325 N Star Rd
- 6316 N Star Rd
- 6396 N Star Rd
- 6311 N Star Rd
- 6782 N Star Rd
- 6786 N Star Rd
- 6408 N Star Rd
- 6329 N Star Rd
- 6289 N Star Rd
- 6262 N Star Rd
- 6255 N Star Rd
- 6461 N Star Rd
- 3553 Aldergrove Rd
- 3390 Hidden Pond Dr
- 3541 Aldergrove Rd
- 6224 N Star Rd