6357 Renee St Springfield, OH 45502
Estimated Value: $339,000 - $463,000
4
Beds
3
Baths
2,511
Sq Ft
$155/Sq Ft
Est. Value
About This Home
This home is located at 6357 Renee St, Springfield, OH 45502 and is currently estimated at $389,925, approximately $155 per square foot. 6357 Renee St is a home located in Clark County with nearby schools including Northridge Elementary School, Kenton Ridge Middle & High School, and Emmanuel Christian Academy.
Ownership History
Date
Name
Owned For
Owner Type
Purchase Details
Closed on
Aug 29, 2012
Sold by
Frysinger Thomas C and Frysinger Phyllis A
Bought by
Phyllis A Frysinger A and Phyllis Thomas C
Current Estimated Value
Purchase Details
Closed on
Nov 15, 2005
Sold by
Rhoades Tommy J and Rhoades Marsha A
Bought by
Frysinger Thomas C and Frysinger Phyllis A
Home Financials for this Owner
Home Financials are based on the most recent Mortgage that was taken out on this home.
Original Mortgage
$66,400
Interest Rate
6.04%
Mortgage Type
Fannie Mae Freddie Mac
Purchase Details
Closed on
Sep 30, 2002
Sold by
Lotz Robert F and Lotz Barbara L
Bought by
Rhoades Tommy J and Rhoades Marsha A
Home Financials for this Owner
Home Financials are based on the most recent Mortgage that was taken out on this home.
Original Mortgage
$124,000
Interest Rate
6.39%
Purchase Details
Closed on
May 1, 1985
Create a Home Valuation Report for This Property
The Home Valuation Report is an in-depth analysis detailing your home's value as well as a comparison with similar homes in the area
Purchase History
| Date | Buyer | Sale Price | Title Company |
|---|---|---|---|
| Phyllis A Frysinger A | -- | -- | |
| Frysinger Thomas C | $180,000 | -- | |
| Rhoades Tommy J | $155,000 | -- | |
| -- | $72,000 | -- |
Source: Public Records
Mortgage History
| Date | Status | Borrower | Loan Amount |
|---|---|---|---|
| Previous Owner | Frysinger Thomas C | $66,400 | |
| Previous Owner | Rhoades Tommy J | $124,000 | |
| Closed | Rhoades Tommy J | $15,500 |
Source: Public Records
Tax History
| Year | Tax Paid | Tax Assessment Tax Assessment Total Assessment is a certain percentage of the fair market value that is determined by local assessors to be the total taxable value of land and additions on the property. | Land | Improvement |
|---|---|---|---|---|
| 2025 | $3,443 | $126,670 | $30,290 | $96,380 |
| 2024 | $3,356 | $88,470 | $21,980 | $66,490 |
| 2023 | $3,356 | $88,470 | $21,980 | $66,490 |
| 2022 | $0 | $88,470 | $21,980 | $66,490 |
| 2021 | $3,545 | $79,450 | $17,450 | $62,000 |
| 2020 | $3,548 | $79,450 | $17,450 | $62,000 |
| 2019 | $3,616 | $79,450 | $17,450 | $62,000 |
| 2018 | $2,951 | $64,150 | $17,450 | $46,700 |
| 2017 | $2,530 | $74,715 | $17,448 | $57,267 |
| 2016 | $2,512 | $74,715 | $17,448 | $57,267 |
| 2015 | $1,273 | $74,715 | $17,448 | $57,267 |
| 2014 | $2,545 | $74,715 | $17,448 | $57,267 |
| 2013 | $1,243 | $74,715 | $17,448 | $57,267 |
Source: Public Records
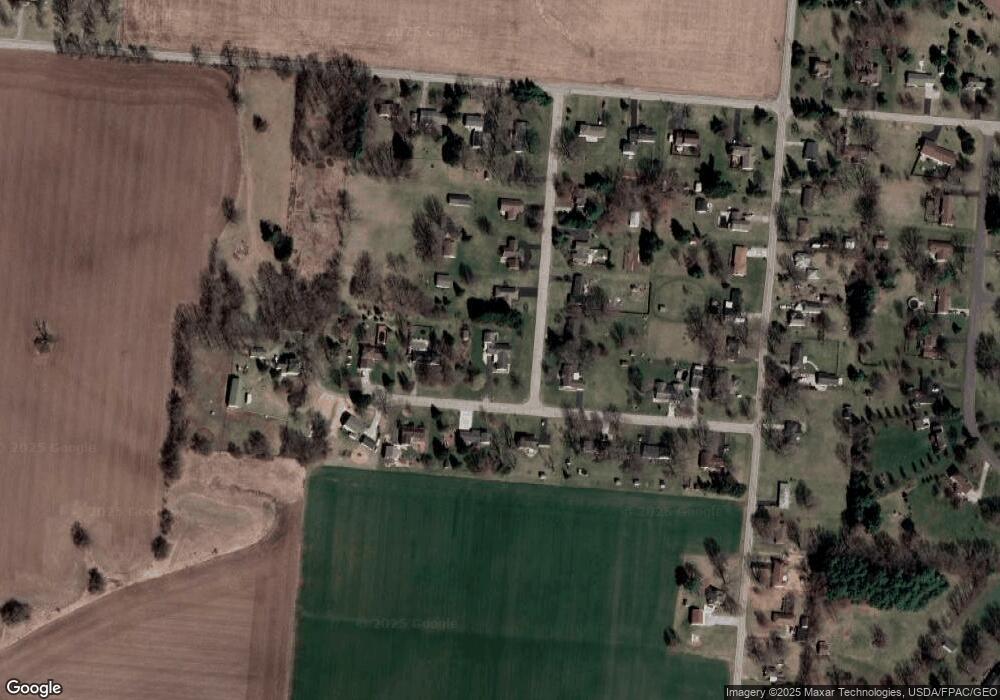
Map
Nearby Homes
- 4273 Kay Ave
- 4607 Plateau Dr S
- 4954 E County Line Rd
- 4293 Yale St
- 5060 Morris Rd
- 1977 Willoughby Ave
- 1836 Dunseth Ln
- 1812 Willow Lakes Dr
- 4500 Bosart Rd
- 4890 Brannan Dr W Unit 4890
- 9 Middle Urbana Rd
- 1470 Oldham Dr Unit 12
- 1398 Elizabeth Ct Unit 66
- 5564 Ridgewood Rd E Unit 7
- 1495 Victorian Way
- 1521 Erika Dr
- 5033 Ridgewood Rd E
- 5564 Ridgewood Rd W
- 4652 Reno Ln Unit 15
- 4180 Briarwood Dr
Your Personal Tour Guide
Ask me questions while you tour the home.