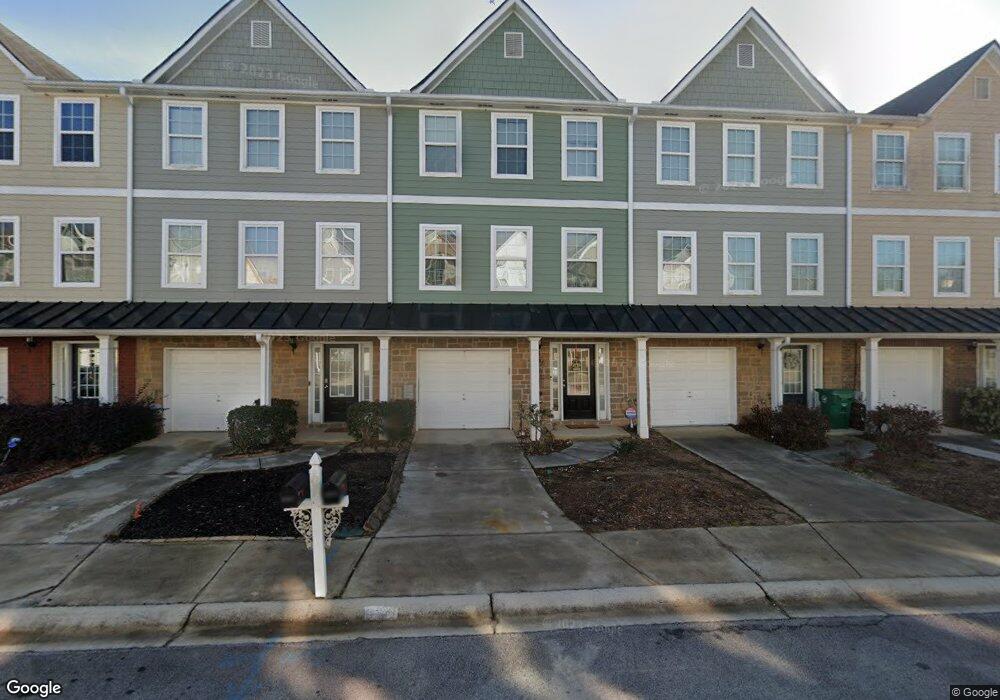
6359 Redan Square Unit 48 Lithonia, GA 30058
Estimated Value: $208,000 - $238,000
2
Beds
3
Baths
2,049
Sq Ft
$108/Sq Ft
Est. Value
About This Home
This home is located at 6359 Redan Square Unit 48, Lithonia, GA 30058 and is currently estimated at $221,282, approximately $107 per square foot. 6359 Redan Square Unit 48 is a home located in DeKalb County with nearby schools including Redan Elementary School, Lithonia Middle School, and Lithonia High School.
Ownership History
Date
Name
Owned For
Owner Type
Purchase Details
Closed on
Apr 9, 2019
Sold by
Zare Behnam
Bought by
Murray India Ceonna
Current Estimated Value
Home Financials for this Owner
Home Financials are based on the most recent Mortgage that was taken out on this home.
Original Mortgage
$115,430
Outstanding Balance
$101,276
Interest Rate
4.3%
Mortgage Type
New Conventional
Estimated Equity
$120,006
Purchase Details
Closed on
Aug 2, 2017
Sold by
Goode James
Bought by
Zare Behnam
Purchase Details
Closed on
Oct 28, 2009
Sold by
Deutsche Bank 2006-Ar19
Bought by
Goode James
Purchase Details
Closed on
Jun 2, 2009
Sold by
Gaines Lawren A
Bought by
Indymac Indx Mtg Ln 2006-Ar19
Purchase Details
Closed on
Jun 1, 2006
Sold by
Dozier Communities Llc
Bought by
Gaines Lawren A
Home Financials for this Owner
Home Financials are based on the most recent Mortgage that was taken out on this home.
Original Mortgage
$114,800
Interest Rate
7.5%
Mortgage Type
New Conventional
Create a Home Valuation Report for This Property
The Home Valuation Report is an in-depth analysis detailing your home's value as well as a comparison with similar homes in the area
Home Values in the Area
Average Home Value in this Area
Purchase History
| Date | Buyer | Sale Price | Title Company |
|---|---|---|---|
| Murray India Ceonna | $119,000 | -- | |
| Zare Behnam | $75,000 | -- | |
| Goode James | $42,900 | -- | |
| Indymac Indx Mtg Ln 2006-Ar19 | $42,900 | -- | |
| Gaines Lawren A | $143,500 | -- |
Source: Public Records
Mortgage History
| Date | Status | Borrower | Loan Amount |
|---|---|---|---|
| Open | Murray India Ceonna | $115,430 | |
| Closed | Murray India Ceonna | $4,760 | |
| Previous Owner | Gaines Lawren A | $114,800 |
Source: Public Records
Tax History Compared to Growth
Tax History
| Year | Tax Paid | Tax Assessment Tax Assessment Total Assessment is a certain percentage of the fair market value that is determined by local assessors to be the total taxable value of land and additions on the property. | Land | Improvement |
|---|---|---|---|---|
| 2025 | $2,250 | $95,920 | $20,000 | $75,920 |
| 2024 | $2,297 | $96,640 | $20,000 | $76,640 |
| 2023 | $2,297 | $91,040 | $20,000 | $71,040 |
| 2022 | $1,658 | $71,200 | $6,400 | $64,800 |
| 2021 | $1,392 | $59,000 | $6,400 | $52,600 |
| 2020 | $1,044 | $44,360 | $6,400 | $37,960 |
| 2019 | $1,546 | $34,120 | $6,400 | $27,720 |
| 2018 | $1,218 | $30,000 | $4,520 | $25,480 |
| 2017 | $1,358 | $29,720 | $4,640 | $25,080 |
| 2016 | $1,330 | $29,000 | $4,640 | $24,360 |
| 2014 | $1,260 | $26,760 | $4,640 | $22,120 |
Source: Public Records
Map
Nearby Homes
- 6361 Redan Square
- 6378 Redan Square
- 6202 Redan Overlook
- 6231 Redan Overlook
- 1691 Redan W
- 6242 Redan Overlook Unit 6
- 6322 Scudders Dr
- 1871 Plainsboro Dr
- 2017 S Deshon Rd
- 6415 Shalks Crossing Dr
- 1884 Plainsboro Dr
- 6350 Princeton Ridge Dr
- 6347 Princeton Ridge Dr
- 2000 Stone Mountain Lithonia Rd
- 6463 Castle Court Way
- 1569 Smithson Cove
- 1629 Phillips Rd
- 6380 Phillips Place
- 6238 Phillips Lake Ct
- 6653 Eastbriar Dr
- 6359 Redan Square
- 6361 Redan Square Unit 101
- 6357 Redan Square Unit 49
- 6355 Redan Square Unit 50
- 6363 Redan Square Unit 46
- 6363 Redan Square Unit 6362
- 6363 Redan Square Unit 46
- 6367 Redan Square
- 6369 Redan Square
- 6362 Redan Square
- 6362 Redan Square Unit 6362
- 6360 Redan Square Unit 139
- 6364 Redan Square
- 6358 Redan Square
- 6371 Redan Square
- 6356 Redan Square
- 6356 Redan Square Unit 100 & 101
- 6368 Redan Square Unit 142
- 6368 Redan Square
- 6373 Redan Square