Estimated Value: $1,194,350 - $1,768,000
3
Beds
2
Baths
596
Sq Ft
$2,433/Sq Ft
Est. Value
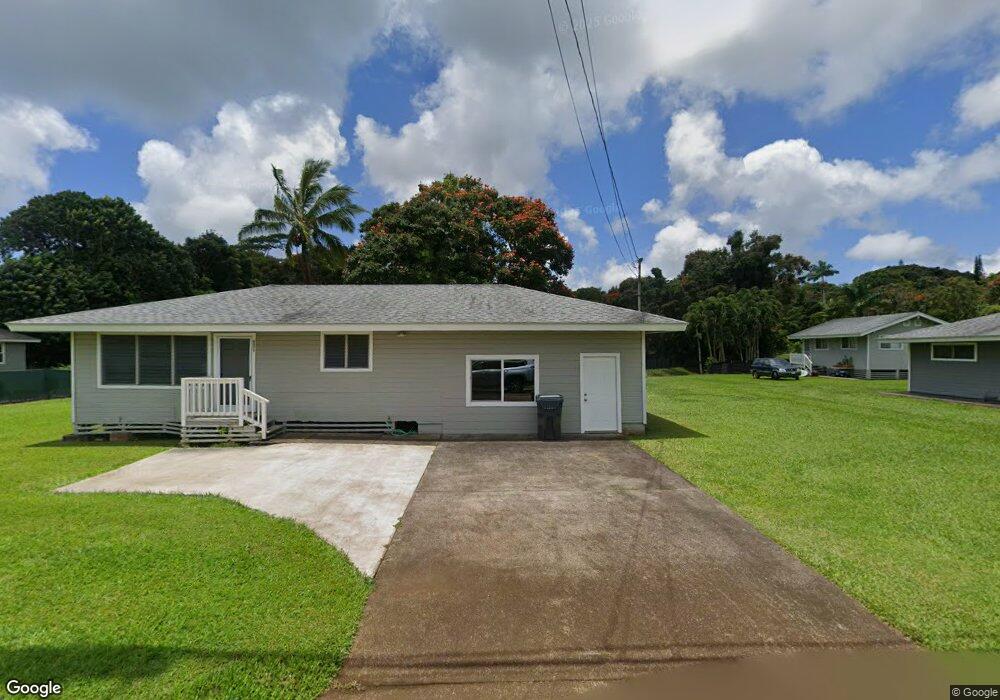
About This Home
This home is located at 6359A Kipapa Rd Unit 1, Kapaa, HI 96746 and is currently estimated at $1,449,838, approximately $2,432 per square foot. 6359A Kipapa Rd Unit 1 is a home located in Kauai County with nearby schools including King Kaumuali'i Elementary School, Kapa'a Middle School, and Kapa'a High School.
Ownership History
Date
Name
Owned For
Owner Type
Purchase Details
Closed on
Oct 14, 2022
Sold by
Chun Van K K and Chun Amy A
Bought by
Van K K Chun Trust and Amy A Chun Trust
Current Estimated Value
Purchase Details
Closed on
Jul 19, 2010
Sold by
Lagazo Genaro T and Lagazo Shelly J
Bought by
Chun Van K K and Chun Amy A
Home Financials for this Owner
Home Financials are based on the most recent Mortgage that was taken out on this home.
Original Mortgage
$198,000
Interest Rate
4.71%
Mortgage Type
New Conventional
Purchase Details
Closed on
May 31, 2006
Sold by
Morris Richard James and Morris Deborah Joyce
Bought by
Lagazo Genaro T and Lagazo Shelly J
Create a Home Valuation Report for This Property
The Home Valuation Report is an in-depth analysis detailing your home's value as well as a comparison with similar homes in the area
Home Values in the Area
Average Home Value in this Area
Purchase History
| Date | Buyer | Sale Price | Title Company |
|---|---|---|---|
| Van K K Chun Trust | -- | None Listed On Document | |
| Van K K Chun Trust | -- | -- | |
| Chun Van K K | $450,000 | Or | |
| Lagazo Genaro T | -- | Security Title Corporation |
Source: Public Records
Mortgage History
| Date | Status | Borrower | Loan Amount |
|---|---|---|---|
| Previous Owner | Chun Van K K | $198,000 |
Source: Public Records
Tax History Compared to Growth
Tax History
| Year | Tax Paid | Tax Assessment Tax Assessment Total Assessment is a certain percentage of the fair market value that is determined by local assessors to be the total taxable value of land and additions on the property. | Land | Improvement |
|---|---|---|---|---|
| 2025 | $5,131 | $929,900 | $599,400 | $330,500 |
| 2024 | $5,131 | $901,900 | $549,500 | $352,400 |
| 2023 | $2,269 | $606,600 | $332,200 | $274,400 |
| 2022 | $2,180 | $588,900 | $0 | $0 |
| 2021 | $2,094 | $571,800 | $0 | $0 |
| 2020 | $2,009 | $555,100 | $294,000 | $261,100 |
| 2019 | $1,831 | $538,900 | $260,400 | $278,500 |
| 2018 | $1,106 | $323,200 | $264,500 | $58,700 |
| 2017 | $1,120 | $328,000 | $209,000 | $119,000 |
| 2016 | $1,075 | $313,200 | $249,800 | $63,400 |
| 2015 | $585 | $524,000 | $0 | $0 |
| 2014 | $1,503 | $484,200 | $0 | $0 |
Source: Public Records
Map
Nearby Homes
- 6421 Kalama Rd Unit 1
- 6395 Olohena Rd Unit 1
- 6161 Holio Rd
- 6271 Opaekaa Rd
- 961 Kamalu Rd
- 411 Molo St
- 6409 Opaekaa Rd Unit 2
- 1370 Hono Ohala Place
- 6573 Puupilo Rd
- 329 Hie St
- 328 Molo St
- 321 Hie St
- 242 Koili Ln
- 5974 Lokelani Rd
- 5891 Ahakea St
- 171 Lani Alii Place
- 147 Royal Dr
- 6546-D Kuamoo Rd Unit 5
- 6546-D Kuamoo Rd Unit 1
- 6546-D Kuamoo Rd Unit 4
- 6359 Kipapa Rd Unit 2
- 6394 Kalama Rd Unit 1
- 6398 Kalama Rd Unit 3
- 6398 Kalama Rd Unit 2
- 6392 Kalama Rd Unit 4
- 6380 Kalama Rd
- 6411 Kipapa Rd
- 6389 Kipapa Rd
- 6371 Kipapa Rd
- 6362 Kalama Rd Unit C
- 6362 Kalama Rd
- 6362 Kalama Rd
- 6362 Kalama Rd Unit A
- 6412 Kalama Rd
- 6376 Kalama Rd
- 6388 Kalama Rd
- 6345 Kipapa Rd
- 6431 Kipapa Rd Unit 2
- 6431 Kipapa Rd Unit 1
- 6406 Kalama Rd Unit 2