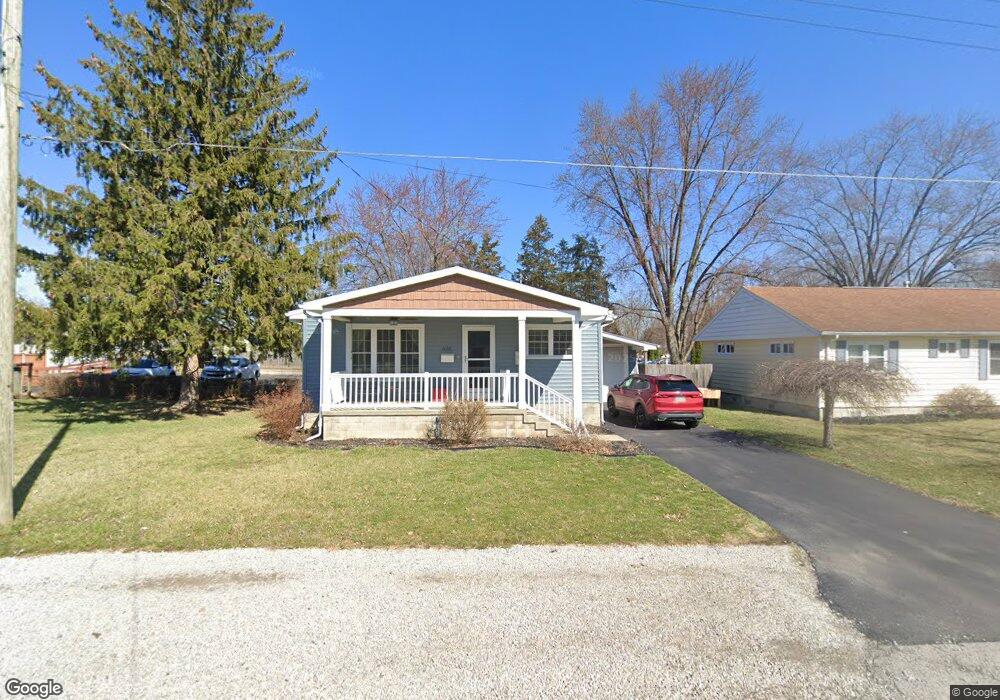
636 2nd St Findlay, OH 45840
Estimated Value: $157,000 - $170,000
3
Beds
2
Baths
1,170
Sq Ft
$138/Sq Ft
Est. Value
About This Home
This home is located at 636 2nd St, Findlay, OH 45840 and is currently estimated at $161,739, approximately $138 per square foot. 636 2nd St is a home located in Hancock County with nearby schools including Whittier Elementary School, Wilson Vance Elementary School, and Donnell Middle School.
Ownership History
Date
Name
Owned For
Owner Type
Purchase Details
Closed on
Sep 24, 1997
Sold by
Conrad Donavon
Bought by
Fluga Danielle and Gelbaugh Adam
Current Estimated Value
Home Financials for this Owner
Home Financials are based on the most recent Mortgage that was taken out on this home.
Original Mortgage
$70,775
Outstanding Balance
$10,692
Interest Rate
7.63%
Mortgage Type
New Conventional
Estimated Equity
$151,047
Create a Home Valuation Report for This Property
The Home Valuation Report is an in-depth analysis detailing your home's value as well as a comparison with similar homes in the area
Home Values in the Area
Average Home Value in this Area
Purchase History
| Date | Buyer | Sale Price | Title Company |
|---|---|---|---|
| Fluga Danielle | $74,500 | -- |
Source: Public Records
Mortgage History
| Date | Status | Borrower | Loan Amount |
|---|---|---|---|
| Open | Fluga Danielle | $70,775 |
Source: Public Records
Tax History
| Year | Tax Paid | Tax Assessment Tax Assessment Total Assessment is a certain percentage of the fair market value that is determined by local assessors to be the total taxable value of land and additions on the property. | Land | Improvement |
|---|---|---|---|---|
| 2024 | $1,216 | $34,240 | $3,470 | $30,770 |
| 2023 | $1,218 | $34,240 | $3,470 | $30,770 |
| 2022 | $1,214 | $34,240 | $3,470 | $30,770 |
| 2021 | $998 | $24,510 | $4,070 | $20,440 |
| 2020 | $997 | $24,510 | $4,070 | $20,440 |
| 2019 | $977 | $24,510 | $4,070 | $20,440 |
| 2018 | $1,050 | $24,110 | $4,070 | $20,040 |
| 2017 | $1,048 | $24,110 | $4,070 | $20,040 |
| 2016 | $1,043 | $24,110 | $4,070 | $20,040 |
| 2015 | $1,136 | $25,990 | $4,070 | $21,920 |
| 2014 | $1,137 | $25,990 | $4,070 | $21,920 |
| 2012 | $1,128 | $25,550 | $4,070 | $21,480 |
Source: Public Records
Map
Nearby Homes
- 731 5th St
- 216 1st St
- 829 Maple Ave
- 206 Greenlawn Ave
- 123 Glendale Ave
- 1100 Stall Dr
- 865 S Main St
- 15591 Canadian Way
- 15586 Canadian Way
- 15615 Canadian Way
- 1037 Fishlock Ave
- 331 Fairlawn Place
- 315 Fairlawn Place
- 1304 Douglas Pkwy
- 1200 1st St
- 1709 Eastview Dr
- 0 Blanchard Ave
- 1726 Eastview Dr
- 324 W Mcpherson Ave
- 1113 Hurd Ave
- 640 2nd St
- 1024 Linden Ave
- 1027 S Blanchard St
- 1031 S Blanchard St
- 1025 S Blanchard St
- 1021 S Blanchard St
- 1101 S Blanchard St
- 641 2nd St
- 637 2nd St
- 1015 S Blanchard St
- 0 S Blanchard St
- 700 2nd St
- 1105 S Blanchard St
- 1024 S Blanchard St
- 1011 S Blanchard St
- 703 2nd St Unit 705
- 1007 S Blanchard St
- 1007 S Blanchard St
- 1016 S Blanchard St
- 1115 S Blanchard St
Your Personal Tour Guide
Ask me questions while you tour the home.