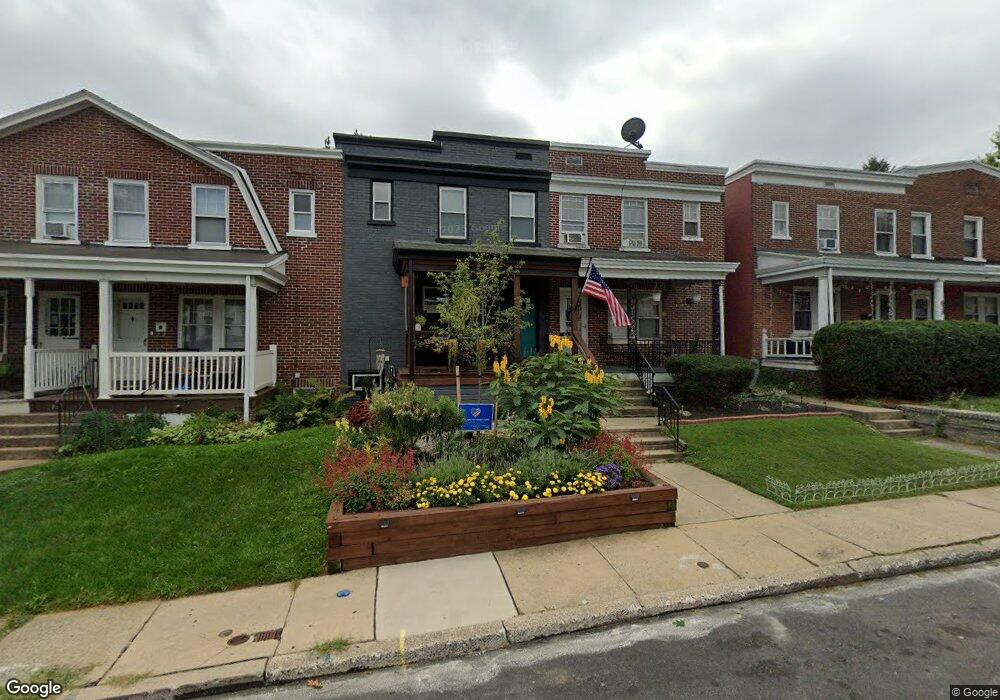
636 3rd St Lancaster, PA 17603
West End NeighborhoodEstimated Value: $162,000 - $235,000
3
Beds
1
Bath
1,394
Sq Ft
$145/Sq Ft
Est. Value
About This Home
This home is located at 636 3rd St, Lancaster, PA 17603 and is currently estimated at $201,491, approximately $144 per square foot. 636 3rd St is a home located in Lancaster County with nearby schools including Lafayette Elementary School, Wheatland Middle School, and McCaskey High School.
Ownership History
Date
Name
Owned For
Owner Type
Purchase Details
Closed on
Oct 31, 2025
Sold by
Johnson Cecilia J and Johnson Timothy K
Bought by
Restored Investments Llc
Current Estimated Value
Home Financials for this Owner
Home Financials are based on the most recent Mortgage that was taken out on this home.
Original Mortgage
$195,000
Outstanding Balance
$195,000
Interest Rate
6.26%
Mortgage Type
Construction
Estimated Equity
$6,491
Purchase Details
Closed on
May 23, 2001
Sold by
Gordon Carol Ann and Estate Of Edith M Veith
Bought by
Johnson Timothy K and Henderson Cecilia J
Home Financials for this Owner
Home Financials are based on the most recent Mortgage that was taken out on this home.
Original Mortgage
$61,000
Interest Rate
7.09%
Mortgage Type
FHA
Create a Home Valuation Report for This Property
The Home Valuation Report is an in-depth analysis detailing your home's value as well as a comparison with similar homes in the area
Home Values in the Area
Average Home Value in this Area
Purchase History
| Date | Buyer | Sale Price | Title Company |
|---|---|---|---|
| Restored Investments Llc | $160,000 | Capstone Agent Transfer Servic | |
| Johnson Timothy K | $61,500 | -- |
Source: Public Records
Mortgage History
| Date | Status | Borrower | Loan Amount |
|---|---|---|---|
| Open | Restored Investments Llc | $195,000 | |
| Previous Owner | Johnson Timothy K | $61,000 |
Source: Public Records
Tax History
| Year | Tax Paid | Tax Assessment Tax Assessment Total Assessment is a certain percentage of the fair market value that is determined by local assessors to be the total taxable value of land and additions on the property. | Land | Improvement |
|---|---|---|---|---|
| 2025 | $3,577 | $90,400 | $20,400 | $70,000 |
| 2024 | $3,577 | $90,400 | $20,400 | $70,000 |
| 2023 | $3,517 | $90,400 | $20,400 | $70,000 |
| 2022 | $3,370 | $90,400 | $20,400 | $70,000 |
| 2021 | $3,298 | $90,400 | $20,400 | $70,000 |
| 2020 | $3,298 | $90,400 | $20,400 | $70,000 |
| 2019 | $3,249 | $90,400 | $20,400 | $70,000 |
| 2018 | $1,928 | $90,400 | $20,400 | $70,000 |
| 2017 | $3,110 | $67,700 | $15,900 | $51,800 |
| 2016 | $3,081 | $67,700 | $15,900 | $51,800 |
| 2015 | $1,202 | $67,700 | $15,900 | $51,800 |
| 2014 | $2,689 | $67,700 | $15,900 | $51,800 |
Source: Public Records
Map
Nearby Homes
Your Personal Tour Guide
Ask me questions while you tour the home.