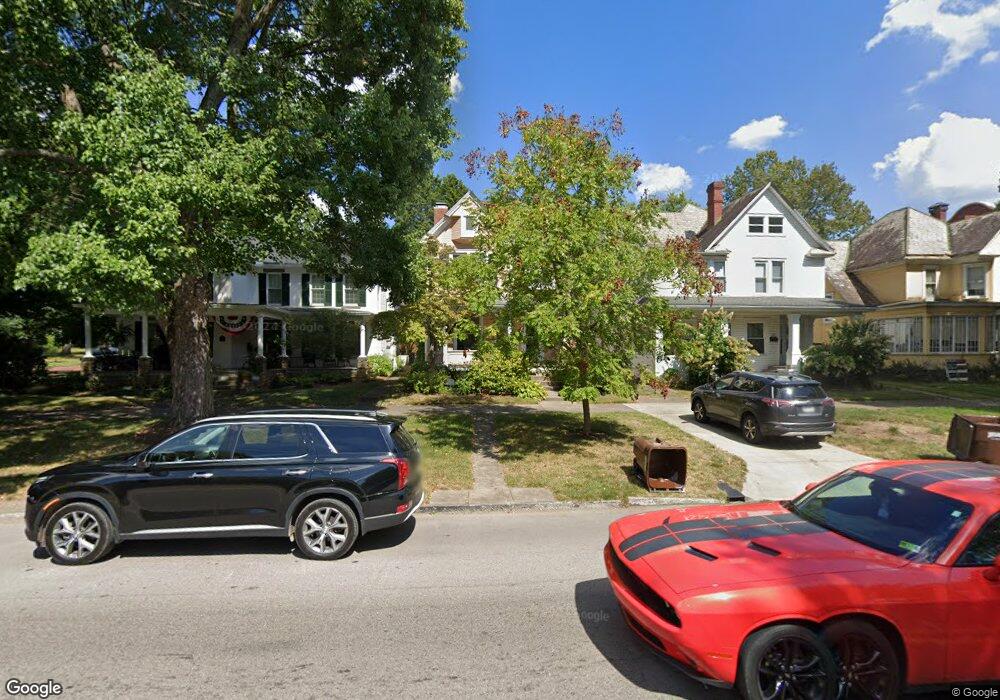
636 3rd St Marietta, OH 45750
Estimated Value: $190,093 - $216,000
3
Beds
2
Baths
1,695
Sq Ft
$118/Sq Ft
Est. Value
About This Home
This home is located at 636 3rd St, Marietta, OH 45750 and is currently estimated at $200,273, approximately $118 per square foot. 636 3rd St is a home located in Washington County with nearby schools including Marietta High School, St. Mary Catholic School, and Veritas Classical Academy.
Ownership History
Date
Name
Owned For
Owner Type
Purchase Details
Closed on
Jul 30, 2007
Sold by
Morrison Kenneth E and Morrison Theresa
Bought by
K Morrison Properties Llc
Current Estimated Value
Purchase Details
Closed on
Apr 2, 2001
Bought by
Morrison Kenneth E
Purchase Details
Closed on
Feb 19, 1998
Bought by
Morrison Kenneth E and Morrison Chr
Purchase Details
Closed on
Jun 9, 1997
Bought by
Fouss
Purchase Details
Closed on
Oct 1, 1992
Bought by
Spearman David R and Spearman Teres
Purchase Details
Closed on
Mar 30, 1990
Bought by
Clark Peter T and Clark Monica G
Create a Home Valuation Report for This Property
The Home Valuation Report is an in-depth analysis detailing your home's value as well as a comparison with similar homes in the area
Home Values in the Area
Average Home Value in this Area
Purchase History
| Date | Buyer | Sale Price | Title Company |
|---|---|---|---|
| K Morrison Properties Llc | -- | None Available | |
| Morrison Kenneth E | -- | -- | |
| Morrison Kenneth E | -- | -- | |
| Morrison Kenneth E | -- | -- | |
| Morrison Kenneth E | -- | -- | |
| Fouss | $69,000 | -- | |
| Fouss | $69,000 | -- | |
| Spearman David R | $62,000 | -- | |
| Spearman David R | $62,000 | -- | |
| Clark Peter T | $55,000 | -- | |
| Clark Peter T | $55,000 | -- |
Source: Public Records
Tax History
| Year | Tax Paid | Tax Assessment Tax Assessment Total Assessment is a certain percentage of the fair market value that is determined by local assessors to be the total taxable value of land and additions on the property. | Land | Improvement |
|---|---|---|---|---|
| 2024 | $2,067 | $51,520 | $6,980 | $44,540 |
| 2023 | $1,745 | $51,520 | $6,980 | $44,540 |
| 2022 | $1,728 | $51,520 | $6,980 | $44,540 |
| 2021 | $1,141 | $32,270 | $5,670 | $26,600 |
| 2020 | $1,154 | $32,270 | $5,670 | $26,600 |
| 2019 | $1,145 | $32,270 | $5,670 | $26,600 |
| 2018 | $1,061 | $29,060 | $4,730 | $24,330 |
| 2017 | $1,059 | $29,060 | $4,730 | $24,330 |
| 2016 | $1,057 | $29,060 | $4,730 | $24,330 |
| 2015 | $1,058 | $27,750 | $4,870 | $22,880 |
| 2014 | $1,784 | $27,750 | $4,870 | $22,880 |
| 2013 | $530 | $27,750 | $4,870 | $22,880 |
Source: Public Records
Map
Nearby Homes
Your Personal Tour Guide
Ask me questions while you tour the home.