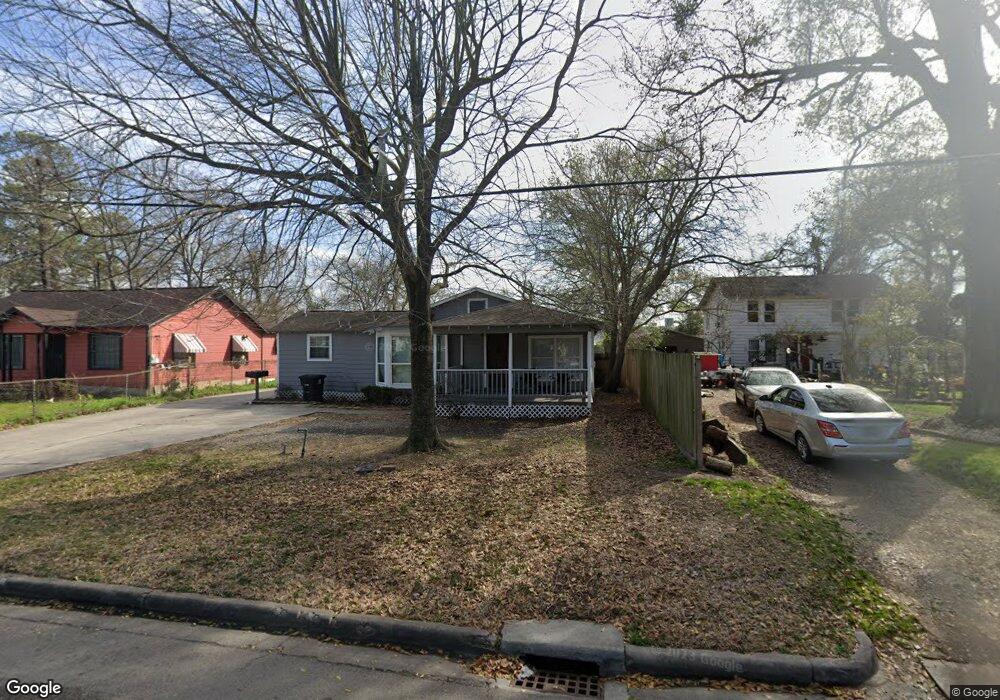
636 Bennington St Unit A Houston, TX 77022
Northside-Northline NeighborhoodEstimated Value: $310,000 - $408,000
3
Beds
1
Bath
2,650
Sq Ft
$136/Sq Ft
Est. Value
About This Home
This home is located at 636 Bennington St Unit A, Houston, TX 77022 and is currently estimated at $360,413, approximately $136 per square foot. 636 Bennington St Unit A is a home located in Harris County with nearby schools including Herrera Elementary School, Burbank Middle School, and Sam Houston Math, Science & Technology Center.
Ownership History
Date
Name
Owned For
Owner Type
Purchase Details
Closed on
Apr 7, 2025
Sold by
Orellana Vilma Del Carmen
Bought by
Carrilo Jose Gerardo Mora and De Moran Yoselin
Current Estimated Value
Home Financials for this Owner
Home Financials are based on the most recent Mortgage that was taken out on this home.
Original Mortgage
$241,000
Outstanding Balance
$236,794
Interest Rate
5.94%
Mortgage Type
Seller Take Back
Estimated Equity
$123,619
Purchase Details
Closed on
Sep 22, 2014
Sold by
Wells Fargo Bank Na
Bought by
Orellana Vilma Del Carmen
Purchase Details
Closed on
May 13, 2014
Sold by
Barrera Isidro and Barrera Alicia
Bought by
Wells Fargo Bank Na
Purchase Details
Closed on
Nov 22, 2010
Sold by
Barrera Alicia
Bought by
Barrera Maria Angelica
Purchase Details
Closed on
Aug 31, 1998
Sold by
Barrera Maria A
Bought by
Barrera Isidro and Barrera Alicia
Purchase Details
Closed on
Feb 26, 1996
Sold by
Munive Prime Norma A and Munive Norma A
Bought by
Barrera Maria A
Create a Home Valuation Report for This Property
The Home Valuation Report is an in-depth analysis detailing your home's value as well as a comparison with similar homes in the area
Home Values in the Area
Average Home Value in this Area
Purchase History
| Date | Buyer | Sale Price | Title Company |
|---|---|---|---|
| Carrilo Jose Gerardo Mora | -- | Fidelity National Title | |
| Orellana Vilma Del Carmen | -- | None Available | |
| Wells Fargo Bank Na | $89,933 | None Available | |
| Barrera Maria Angelica | -- | None Available | |
| Barrera Isidro | -- | -- | |
| Barrera Maria A | -- | Fidelity National Title |
Source: Public Records
Mortgage History
| Date | Status | Borrower | Loan Amount |
|---|---|---|---|
| Open | Carrilo Jose Gerardo Mora | $241,000 |
Source: Public Records
Tax History Compared to Growth
Tax History
| Year | Tax Paid | Tax Assessment Tax Assessment Total Assessment is a certain percentage of the fair market value that is determined by local assessors to be the total taxable value of land and additions on the property. | Land | Improvement |
|---|---|---|---|---|
| 2025 | $9,184 | $438,922 | $102,000 | $336,922 |
| 2024 | $9,184 | $438,922 | $102,000 | $336,922 |
| 2023 | $9,184 | $488,347 | $102,000 | $386,347 |
| 2022 | $10,304 | $467,947 | $81,600 | $386,347 |
| 2021 | $8,965 | $384,651 | $81,600 | $303,051 |
| 2020 | $8,956 | $369,855 | $81,600 | $288,255 |
| 2019 | $10,287 | $406,536 | $71,400 | $335,136 |
| 2018 | $5,345 | $211,215 | $45,900 | $165,315 |
| 2017 | $5,341 | $211,215 | $45,900 | $165,315 |
| 2016 | $4,651 | $183,940 | $45,900 | $138,040 |
| 2015 | $1,581 | $183,762 | $45,900 | $137,862 |
| 2014 | $1,581 | $61,487 | $30,600 | $30,887 |
Source: Public Records
Map
Nearby Homes
- 603 Dorchester St
- 809 Dorchester St
- 6515 Lloyd St
- 408 Frisco St
- 931 Bennington St
- 6825 Appleton St
- 7206 Helmers St Unit A
- 7208 Helmers St
- 613 Melbourne St
- 321 King St
- 214 Frisco St
- 7015 Roswell St
- 515 Caplin St
- 311 & 309 Bennington St
- 522 Caplin St
- 319 Melbourne St
- 610 Caplin St
- 1009 Wainwright St
- 702 Caplin St
- 513 Reid St
- 636 Bennington St
- 638 Bennington St
- 632 Bennington St
- 702 Bennington St
- 630 Bennington St
- 628 Bennington St
- 704 Bennington St
- 637 Bennington St
- 639 Bennington St
- 624 Bennington St
- 708 Bennington St
- 631 Bennington St
- 701 Bennington St
- 703 Bennington St
- 710 Bennington St
- 623 Bennington St
- 707 Bennington St
- 716 Bennington St
- 709 Bennington St
- 634 Dorchester St