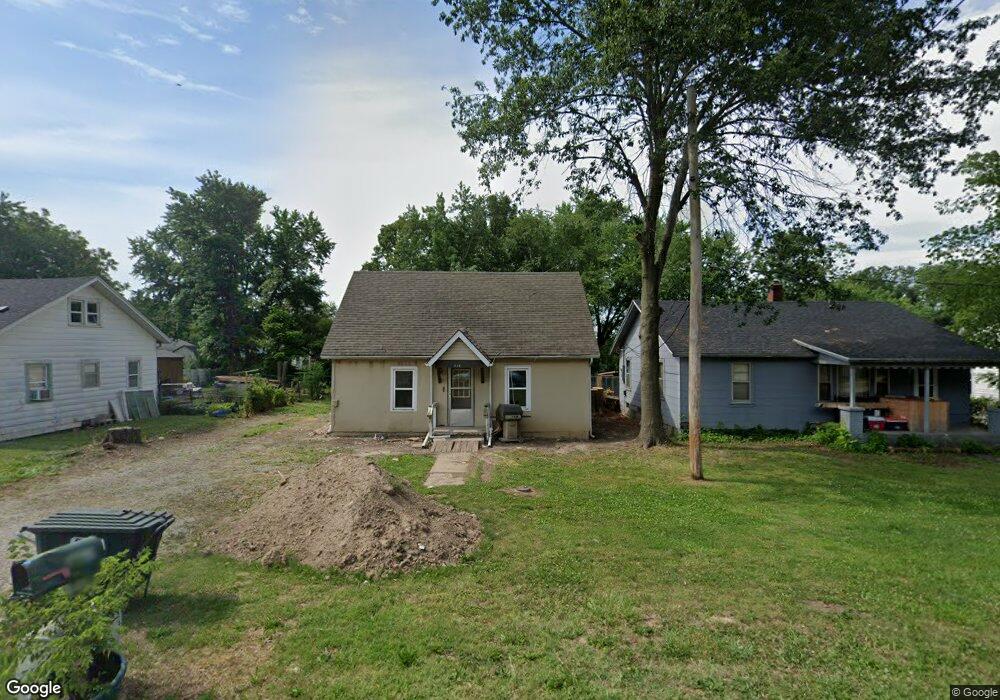
636 Brice St Lebanon, MO 65536
Estimated Value: $108,000 - $162,000
3
Beds
1
Bath
1,042
Sq Ft
$121/Sq Ft
Est. Value
About This Home
This home is located at 636 Brice St, Lebanon, MO 65536 and is currently estimated at $126,492, approximately $121 per square foot. 636 Brice St is a home located in Laclede County with nearby schools including Joe D. Esther Elementary School, Boswell Elementary School, and Maplecrest Elementary School.
Ownership History
Date
Name
Owned For
Owner Type
Purchase Details
Closed on
May 9, 2025
Sold by
Pen Investments Llc
Bought by
Dieman Abigail R
Current Estimated Value
Home Financials for this Owner
Home Financials are based on the most recent Mortgage that was taken out on this home.
Original Mortgage
$100,000
Outstanding Balance
$99,646
Interest Rate
6.65%
Mortgage Type
New Conventional
Estimated Equity
$26,846
Purchase Details
Closed on
May 18, 2012
Sold by
Central Bank
Bought by
Pendergraft Robert Eugene and Pendergraft Deborah Lynn
Purchase Details
Closed on
Mar 29, 2012
Sold by
Hendricks Phoebe
Bought by
Central Bank
Purchase Details
Closed on
Nov 20, 2006
Sold by
King Lawrence J
Bought by
King Debbi
Purchase Details
Closed on
Oct 3, 2005
Sold by
King L Joseph
Bought by
King Debbi
Purchase Details
Closed on
May 20, 2005
Sold by
Hendricks Willie
Bought by
King Debbi
Create a Home Valuation Report for This Property
The Home Valuation Report is an in-depth analysis detailing your home's value as well as a comparison with similar homes in the area
Home Values in the Area
Average Home Value in this Area
Purchase History
| Date | Buyer | Sale Price | Title Company |
|---|---|---|---|
| Dieman Abigail R | -- | Hogan Land Title | |
| Dieman Abigail R | -- | Hogan Land Title | |
| Pendergraft Robert Eugene | -- | None Available | |
| Central Bank | $19,600 | None Available | |
| King Debbi | -- | None Available | |
| King Debbi | -- | None Available | |
| King Debbi | -- | None Available |
Source: Public Records
Mortgage History
| Date | Status | Borrower | Loan Amount |
|---|---|---|---|
| Open | Dieman Abigail R | $100,000 | |
| Closed | Dieman Abigail R | $100,000 |
Source: Public Records
Tax History Compared to Growth
Tax History
| Year | Tax Paid | Tax Assessment Tax Assessment Total Assessment is a certain percentage of the fair market value that is determined by local assessors to be the total taxable value of land and additions on the property. | Land | Improvement |
|---|---|---|---|---|
| 2025 | $325 | $6,350 | $0 | $0 |
| 2024 | $325 | $5,700 | $0 | $0 |
| 2023 | $335 | $5,700 | $0 | $0 |
| 2022 | $312 | $5,700 | $0 | $0 |
| 2021 | $344 | $5,700 | $1,216 | $4,484 |
| 2020 | $345 | $5,700 | $1,216 | $4,484 |
| 2019 | $331 | $5,700 | $1,220 | $4,480 |
| 2018 | $279 | $5,130 | $1,220 | $3,910 |
| 2017 | $265 | $5,130 | $0 | $0 |
| 2016 | $265 | $5,130 | $0 | $0 |
| 2015 | $265 | $5,130 | $0 | $0 |
| 2014 | $265 | $5,130 | $0 | $0 |
| 2013 | -- | $5,130 | $0 | $0 |
Source: Public Records
Map
Nearby Homes
- 1250 N Jefferson Ave
- 105 S King St
- 175 Walser St
- 116 Smith Rd
- 282 Brice St
- 218 S King St
- 274 Cornelison St
- 376 Sunset Dr
- 791 N Adams Ave
- 009 Missouri 64
- 000 Missouri 64 Unit Lot 18
- 000 Missouri 64
- 000 Missouri 64 Unit Lot 16
- 002 Missouri 64
- 005 Missouri 64
- 000 Missouri 64 Unit Lot 14
- 003 Missouri 64
- 000 Missouri 64 Unit Lot 11
- 000 Missouri 64 Unit 17-19
- 012 Missouri 64