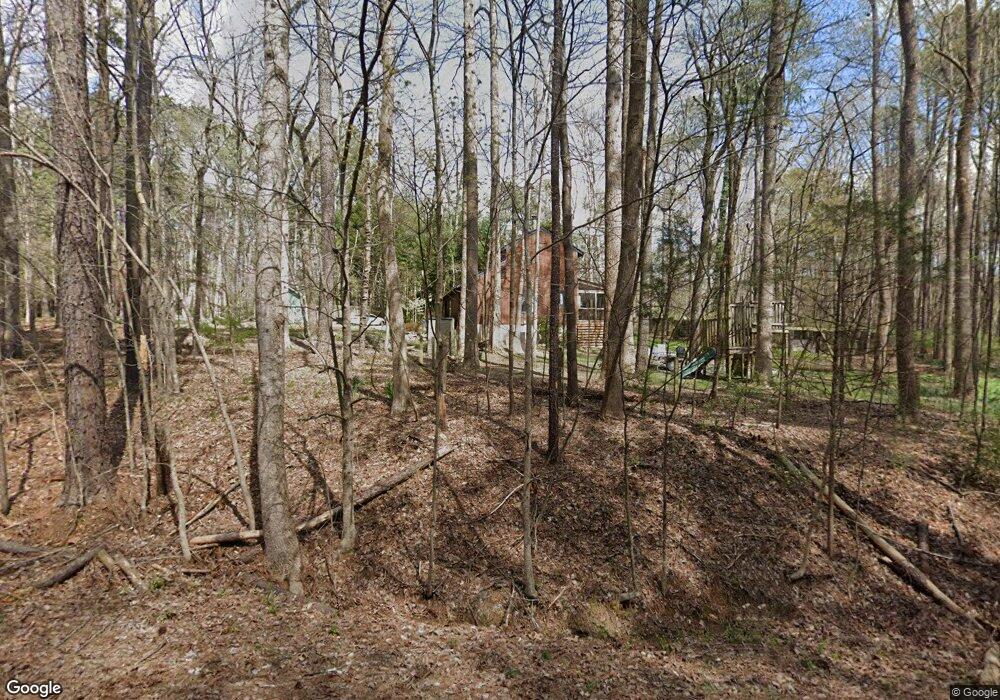
636 Carl Dr Chapel Hill, NC 27516
University Lakes NeighborhoodEstimated Value: $415,000 - $507,000
3
Beds
2
Baths
1,655
Sq Ft
$276/Sq Ft
Est. Value
About This Home
This home is located at 636 Carl Dr, Chapel Hill, NC 27516 and is currently estimated at $456,883, approximately $276 per square foot. 636 Carl Dr is a home located in Orange County with nearby schools including C and L Mcdougle Elementary School, McDougle Middle School, and Chapel Hill High School.
Ownership History
Date
Name
Owned For
Owner Type
Purchase Details
Closed on
Oct 22, 2018
Sold by
Winningham Darren and Winningham Kami
Bought by
Fox Gretchen
Current Estimated Value
Home Financials for this Owner
Home Financials are based on the most recent Mortgage that was taken out on this home.
Original Mortgage
$277,400
Outstanding Balance
$240,409
Interest Rate
4.5%
Mortgage Type
New Conventional
Estimated Equity
$216,474
Purchase Details
Closed on
Apr 28, 2011
Sold by
Johnson Libre and Beck Bridget M
Bought by
Winningham Darren and Winningham Kami
Home Financials for this Owner
Home Financials are based on the most recent Mortgage that was taken out on this home.
Original Mortgage
$237,590
Interest Rate
4.74%
Mortgage Type
VA
Purchase Details
Closed on
Jun 29, 2004
Sold by
Mehling Patrick L
Bought by
Johnson Libre and Beck Bridget Miriam
Home Financials for this Owner
Home Financials are based on the most recent Mortgage that was taken out on this home.
Original Mortgage
$156,800
Interest Rate
5.87%
Mortgage Type
Fannie Mae Freddie Mac
Create a Home Valuation Report for This Property
The Home Valuation Report is an in-depth analysis detailing your home's value as well as a comparison with similar homes in the area
Home Values in the Area
Average Home Value in this Area
Purchase History
| Date | Buyer | Sale Price | Title Company |
|---|---|---|---|
| Fox Gretchen | $292,000 | None Available | |
| Winningham Darren | $230,000 | None Available | |
| Johnson Libre | $196,000 | -- |
Source: Public Records
Mortgage History
| Date | Status | Borrower | Loan Amount |
|---|---|---|---|
| Open | Fox Gretchen | $277,400 | |
| Previous Owner | Winningham Darren | $237,590 | |
| Previous Owner | Johnson Libre | $156,800 | |
| Closed | Johnson Libre | $39,200 |
Source: Public Records
Tax History
| Year | Tax Paid | Tax Assessment Tax Assessment Total Assessment is a certain percentage of the fair market value that is determined by local assessors to be the total taxable value of land and additions on the property. | Land | Improvement |
|---|---|---|---|---|
| 2025 | $4,082 | $454,400 | $207,000 | $247,400 |
| 2024 | $3,687 | $308,100 | $112,000 | $196,100 |
| 2023 | $3,606 | $308,100 | $112,000 | $196,100 |
| 2022 | $3,226 | $279,100 | $112,000 | $167,100 |
| 2021 | $3,191 | $279,100 | $112,000 | $167,100 |
| 2020 | $3,273 | $268,400 | $112,000 | $156,400 |
| 2018 | $3,216 | $268,400 | $112,000 | $156,400 |
| 2017 | $3,009 | $268,400 | $112,000 | $156,400 |
| 2016 | $3,009 | $244,600 | $61,500 | $183,100 |
| 2015 | $3,009 | $244,600 | $61,500 | $183,100 |
| 2014 | $2,927 | $239,395 | $61,474 | $177,921 |
Source: Public Records
Map
Nearby Homes
- 1101 Hatch Rd
- 246-Ut Rockford Ln
- 206 Wild Turkey Trail
- 1208 Hatch Rd
- 0 Neville Rd Unit 10098491
- 803 Terrace View Dr
- 131 Lavinia Ln
- 842 N Carolina Highway 54 W
- 2903 Neville Rd
- 9510 Gates Ln
- 300 Nc 54 Unit E3
- 216 James St
- 105 Mary St
- 721 Jones Ferry Rd
- 711 Berryhill Dr
- 121 Westview Dr Unit 16
- 121 Westview Dr Unit 27
- 121 Westview Dr Unit 36
- 1100 W Main St
- 1005 W Main St
Your Personal Tour Guide
Ask me questions while you tour the home.