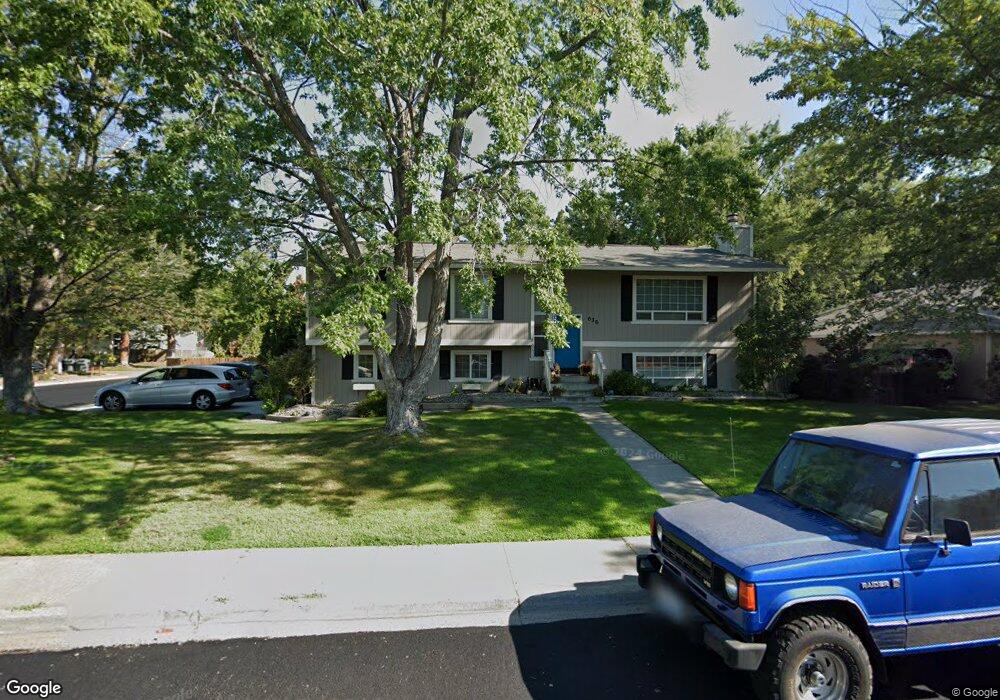
636 Cherrywood Loop Unit Great North Richland Richland, WA 99354
Estimated Value: $498,000 - $596,000
3
Beds
3
Baths
3,052
Sq Ft
$173/Sq Ft
Est. Value
About This Home
This home is located at 636 Cherrywood Loop Unit Great North Richland, Richland, WA 99354 and is currently estimated at $528,472, approximately $173 per square foot. 636 Cherrywood Loop Unit Great North Richland is a home located in Benton County with nearby schools including Sacajawea Elementary School, Chief Joseph Middle School, and Hanford High School.
Ownership History
Date
Name
Owned For
Owner Type
Purchase Details
Closed on
Jun 19, 2017
Sold by
Nettles Curtis Ray and Nettles Jamie L
Bought by
Ayala Juan Carlos and Ammann Ayala Judy A
Current Estimated Value
Home Financials for this Owner
Home Financials are based on the most recent Mortgage that was taken out on this home.
Original Mortgage
$283,500
Outstanding Balance
$235,813
Interest Rate
4.02%
Mortgage Type
New Conventional
Estimated Equity
$292,659
Purchase Details
Closed on
Aug 22, 2013
Sold by
Oehmen Christopher S and Oehmen Barbara Ann
Bought by
Nettles Curtis Ray and Nettles Jamie L
Home Financials for this Owner
Home Financials are based on the most recent Mortgage that was taken out on this home.
Original Mortgage
$219,622
Interest Rate
4.33%
Mortgage Type
VA
Create a Home Valuation Report for This Property
The Home Valuation Report is an in-depth analysis detailing your home's value as well as a comparison with similar homes in the area
Home Values in the Area
Average Home Value in this Area
Purchase History
| Date | Buyer | Sale Price | Title Company |
|---|---|---|---|
| Ayala Juan Carlos | $315,000 | Chicago Title | |
| Nettles Curtis Ray | $215,000 | Tri City Title & Escrow |
Source: Public Records
Mortgage History
| Date | Status | Borrower | Loan Amount |
|---|---|---|---|
| Open | Ayala Juan Carlos | $283,500 | |
| Previous Owner | Nettles Curtis Ray | $219,622 |
Source: Public Records
Tax History Compared to Growth
Tax History
| Year | Tax Paid | Tax Assessment Tax Assessment Total Assessment is a certain percentage of the fair market value that is determined by local assessors to be the total taxable value of land and additions on the property. | Land | Improvement |
|---|---|---|---|---|
| 2024 | $3,799 | $438,310 | $50,000 | $388,310 |
| 2023 | $3,799 | $405,020 | $50,000 | $355,020 |
| 2022 | $3,864 | $349,550 | $50,000 | $299,550 |
| 2021 | $4,020 | $349,550 | $50,000 | $299,550 |
| 2020 | $3,962 | $349,550 | $50,000 | $299,550 |
| 2019 | $3,129 | $325,550 | $42,000 | $283,550 |
| 2018 | $3,212 | $276,660 | $42,000 | $234,660 |
| 2017 | $2,830 | $237,550 | $42,000 | $195,550 |
| 2016 | $2,789 | $237,550 | $42,000 | $195,550 |
| 2015 | $1,302 | $237,550 | $42,000 | $195,550 |
| 2014 | -- | $217,600 | $42,000 | $175,600 |
| 2013 | -- | $217,600 | $42,000 | $175,600 |
Source: Public Records
Map
Nearby Homes
- 21 Nuclear Ln
- 42 Mercury Dr
- 49 Galaxy Ln
- 733 Snyder St
- 49 Proton Ln
- 45 Cosmic Ln
- 50 Compton Ln Unit 51
- 49 Compton Ln
- 324 Saint St
- 517 Catskill St
- 2462 Mullet Ct
- 2342 Davison Ave
- 2445 Westmoreland Dr
- 515 Blue St
- 721 Hanford St
- 2021 Mahan Ave Unit J-6
- 2021 Mahan Ave Unit D8
- 2021 Mahan Ave Unit A5
- 2021 Mahan Ave Unit I8
- 2021 Mahan Ave Unit H-7
- 636 Cherrywood Loop Unit Lovely North Richlan
- 636 Cherrywood Loop Unit Beautiful N. Richlan
- 636 Cherrywood Loop
- 630 Cherrywood Loop
- 619 Snyder St
- 668 Cherrywood Loop
- 666 Cherrywood Loop
- 624 Cherrywood Loop
- 654 Cherrywood Loop
- 641 Cherrywood Loop
- 647 Cherrywood Loop
- 672 Cherrywood Loop Unit Price Reduced!!
- 672 Cherrywood Loop Unit BACK ON MARKET! NORT
- 672 Cherrywood Loop
- 635 Cherrywood Loop
- 649 Cherrywood Loop
- 607 Snyder St
- 618 Cherrywood Loop
- 629 Cherrywood Loop
- 16 Mercury Dr