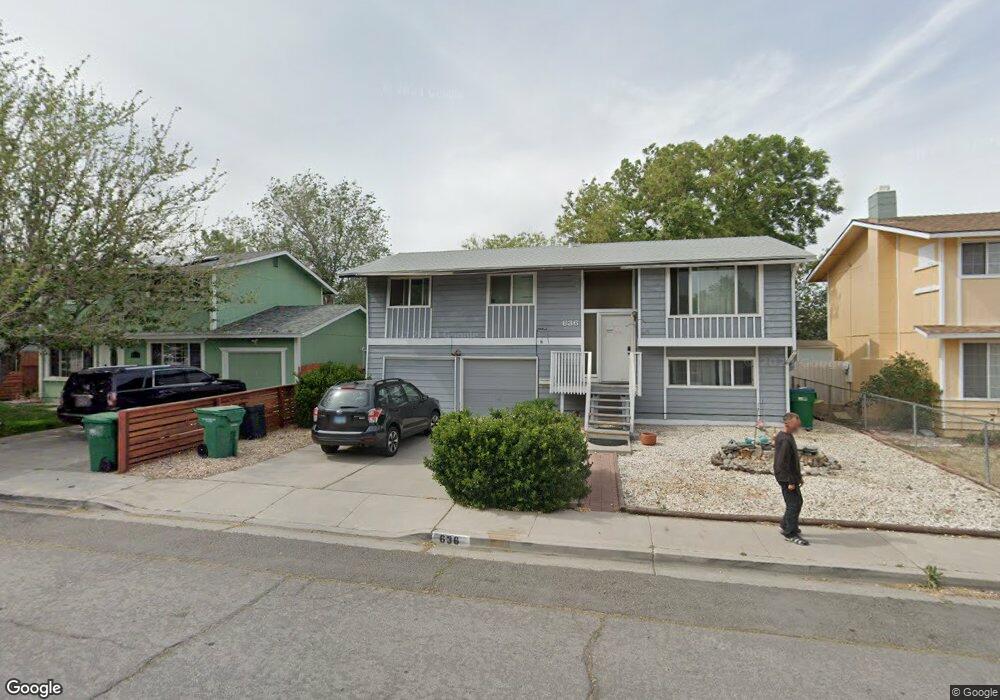
636 E Quail St Sparks, NV 89431
McCarran Boulevard-Probasco NeighborhoodEstimated Value: $387,000 - $480,000
3
Beds
2
Baths
1,396
Sq Ft
$309/Sq Ft
Est. Value
About This Home
This home is located at 636 E Quail St, Sparks, NV 89431 and is currently estimated at $432,045, approximately $309 per square foot. 636 E Quail St is a home located in Washoe County with nearby schools including Greenbrae Elementary School, George L Dilworth Middle School, and Sparks High School.
Ownership History
Date
Name
Owned For
Owner Type
Purchase Details
Closed on
Aug 18, 2025
Sold by
Dickman Blaine R and Dickman Corinne E
Bought by
Br Dickman Family Trust and Dickman
Current Estimated Value
Purchase Details
Closed on
Apr 4, 2005
Sold by
Delos Santos George E and Aucoin Cherie A
Bought by
Dickman Blaine R and Dickman Corinne E
Home Financials for this Owner
Home Financials are based on the most recent Mortgage that was taken out on this home.
Original Mortgage
$187,500
Interest Rate
1.65%
Mortgage Type
Negative Amortization
Purchase Details
Closed on
Sep 28, 2001
Sold by
Patetta Louis J and Patetta Elizabeth J
Bought by
Delossantos George E and Aucion Cherie A
Home Financials for this Owner
Home Financials are based on the most recent Mortgage that was taken out on this home.
Original Mortgage
$133,020
Interest Rate
6.91%
Mortgage Type
FHA
Create a Home Valuation Report for This Property
The Home Valuation Report is an in-depth analysis detailing your home's value as well as a comparison with similar homes in the area
Home Values in the Area
Average Home Value in this Area
Purchase History
| Date | Buyer | Sale Price | Title Company |
|---|---|---|---|
| Br Dickman Family Trust | -- | None Listed On Document | |
| Dickman Blaine R | $254,500 | Stewart Title Of Northern Nv | |
| Delossantos George E | $135,000 | First Centennial Title Co |
Source: Public Records
Mortgage History
| Date | Status | Borrower | Loan Amount |
|---|---|---|---|
| Previous Owner | Dickman Blaine R | $187,500 | |
| Previous Owner | Delossantos George E | $133,020 |
Source: Public Records
Tax History
| Year | Tax Paid | Tax Assessment Tax Assessment Total Assessment is a certain percentage of the fair market value that is determined by local assessors to be the total taxable value of land and additions on the property. | Land | Improvement |
|---|---|---|---|---|
| 2026 | $877 | $53,627 | $34,090 | $19,537 |
| 2025 | $1,088 | $53,297 | $33,565 | $19,732 |
| 2024 | $1,057 | $49,468 | $30,065 | $19,403 |
| 2023 | $1,057 | $49,089 | $31,325 | $17,764 |
| 2022 | $1,027 | $40,654 | $26,180 | $14,474 |
| 2021 | $997 | $32,957 | $17,955 | $15,002 |
| 2020 | $967 | $32,494 | $16,940 | $15,554 |
| 2019 | $921 | $31,328 | $15,890 | $15,438 |
| 2018 | $880 | $27,308 | $11,725 | $15,583 |
| 2017 | $844 | $26,440 | $10,395 | $16,045 |
| 2016 | $822 | $26,136 | $9,345 | $16,791 |
| 2015 | $821 | $24,889 | $7,700 | $17,189 |
| 2014 | $797 | $23,257 | $6,440 | $16,817 |
| 2013 | -- | $21,272 | $4,270 | $17,002 |
Source: Public Records
Map
Nearby Homes
- 1777 Howard Ct
- 480 E Mclean Way
- 370 O'Brien Way
- 2207 Howard Dr
- 1954 Rio Tinto Dr
- 995 Sage View Dr
- 91 E York Way
- 14 E Greenbrae Dr
- 31 E L St
- 8 E O St
- 28 Arndell Way
- 1012 Alta Vista Dr
- 889 Glen Molly Dr
- 2363 William Morby Dr
- 828 Woodglen Dr Unit 2
- 913 Glen Molly Dr
- 801 Woodglen Dr Unit 2
- 11 E J St
- 960 Cherry Tree Dr Unit 1
- 860 Cherry Tree Dr Unit 2
- 606 E Quail St
- 656 E Quail St
- 676 E Quail St
- 596 E Quail St
- 590 Boise Ct
- 686 E Quail St
- 576 E Quail St
- 633 E Quail St
- 653 E Quail St
- 603 E Quail St
- 575 Boise Ct
- 1745 Driftwood Dr
- 593 E Quail St
- 1855 N Mccarran Blvd
- 556 E Quail St
- 573 E Quail St
- 1798 Driftwood Dr
- 536 E Quail St
- 654 Oleander Way
- 1762 Driftwood Dr
Your Personal Tour Guide
Ask me questions while you tour the home.