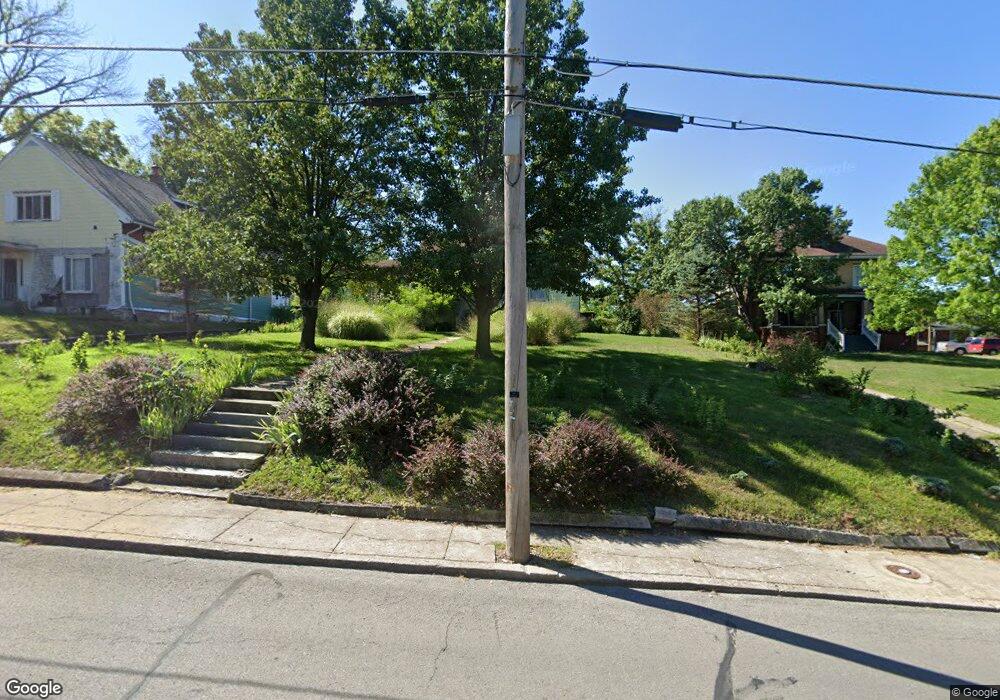
636 Fisk Ave Moberly, MO 65270
Estimated Value: $94,000 - $155,000
3
Beds
1
Bath
1,482
Sq Ft
$81/Sq Ft
Est. Value
About This Home
This home is located at 636 Fisk Ave, Moberly, MO 65270 and is currently estimated at $119,431, approximately $80 per square foot. 636 Fisk Ave is a home located in Randolph County with nearby schools including Moberly Senior High School, St. Pius X. Catholic School, and Maranatha Seventh-day Adventist School.
Ownership History
Date
Name
Owned For
Owner Type
Purchase Details
Closed on
Nov 5, 2013
Sold by
Cole Robin M and Burgin Cole Celeste A
Bought by
Cole Robin M and Cole Celeste A
Current Estimated Value
Home Financials for this Owner
Home Financials are based on the most recent Mortgage that was taken out on this home.
Original Mortgage
$52,000
Outstanding Balance
$12,916
Interest Rate
3.35%
Estimated Equity
$106,515
Create a Home Valuation Report for This Property
The Home Valuation Report is an in-depth analysis detailing your home's value as well as a comparison with similar homes in the area
Home Values in the Area
Average Home Value in this Area
Purchase History
| Date | Buyer | Sale Price | Title Company |
|---|---|---|---|
| Cole Robin M | -- | -- |
Source: Public Records
Mortgage History
| Date | Status | Borrower | Loan Amount |
|---|---|---|---|
| Open | Cole Robin M | $52,000 |
Source: Public Records
Tax History Compared to Growth
Tax History
| Year | Tax Paid | Tax Assessment Tax Assessment Total Assessment is a certain percentage of the fair market value that is determined by local assessors to be the total taxable value of land and additions on the property. | Land | Improvement |
|---|---|---|---|---|
| 2025 | $549 | $8,170 | $1,961 | $6,209 |
| 2024 | $549 | $7,540 | $1,710 | $5,830 |
| 2023 | $557 | $7,540 | $1,710 | $5,830 |
| 2022 | $511 | $7,100 | $1,709 | $5,391 |
| 2021 | $511 | $7,100 | $1,709 | $5,391 |
| 2020 | $511 | $7,100 | $1,709 | $5,391 |
| 2019 | $510 | $7,100 | $1,709 | $5,391 |
| 2018 | $508 | $7,100 | $1,709 | $5,391 |
| 2017 | $507 | $7,100 | $0 | $0 |
| 2016 | $471 | $6,630 | $0 | $0 |
| 2014 | -- | $6,250 | $0 | $0 |
| 2013 | -- | $6,250 | $0 | $0 |
| 2012 | -- | $6,250 | $0 | $0 |
Source: Public Records
Map
Nearby Homes