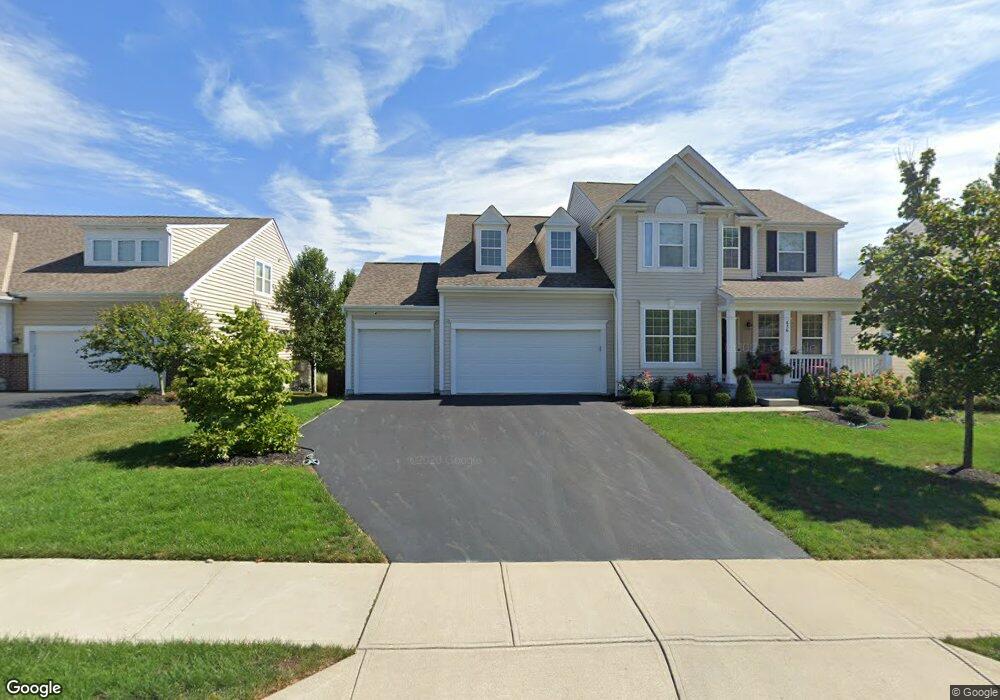
636 High Timber Dr Unit 112 Westerville, OH 43082
Genoa NeighborhoodEstimated Value: $598,471 - $650,000
4
Beds
3
Baths
2,800
Sq Ft
$222/Sq Ft
Est. Value
About This Home
This home is located at 636 High Timber Dr Unit 112, Westerville, OH 43082 and is currently estimated at $620,618, approximately $221 per square foot. 636 High Timber Dr Unit 112 is a home located in Delaware County with nearby schools including Robert Frost Elementary School, Heritage Middle School, and Westerville-North High School.
Ownership History
Date
Name
Owned For
Owner Type
Purchase Details
Closed on
Jun 1, 2015
Sold by
Bidwell Homes Ik Plan
Bought by
Holmes W Chris and Holmes Jessica S
Current Estimated Value
Home Financials for this Owner
Home Financials are based on the most recent Mortgage that was taken out on this home.
Original Mortgage
$340,100
Outstanding Balance
$262,473
Interest Rate
3.65%
Mortgage Type
New Conventional
Estimated Equity
$358,145
Purchase Details
Closed on
Mar 24, 2015
Sold by
Watson Shaun L
Bought by
Bidwell Home Ik Plan
Purchase Details
Closed on
Dec 7, 2010
Sold by
M/I Homes Of Central Ohio Llc
Bought by
Watson Shaun L
Home Financials for this Owner
Home Financials are based on the most recent Mortgage that was taken out on this home.
Original Mortgage
$326,656
Interest Rate
4.23%
Mortgage Type
VA
Create a Home Valuation Report for This Property
The Home Valuation Report is an in-depth analysis detailing your home's value as well as a comparison with similar homes in the area
Home Values in the Area
Average Home Value in this Area
Purchase History
| Date | Buyer | Sale Price | Title Company |
|---|---|---|---|
| Holmes W Chris | $558,000 | Elite Land Title | |
| Bidwell Home Ik Plan | $270,000 | None Available | |
| Watson Shaun L | $319,900 | Transohio Residential Title |
Source: Public Records
Mortgage History
| Date | Status | Borrower | Loan Amount |
|---|---|---|---|
| Open | Holmes W Chris | $340,100 | |
| Previous Owner | Watson Shaun L | $326,656 |
Source: Public Records
Tax History Compared to Growth
Tax History
| Year | Tax Paid | Tax Assessment Tax Assessment Total Assessment is a certain percentage of the fair market value that is determined by local assessors to be the total taxable value of land and additions on the property. | Land | Improvement |
|---|---|---|---|---|
| 2024 | $9,907 | $177,070 | $34,270 | $142,800 |
| 2023 | $9,803 | $177,070 | $34,270 | $142,800 |
| 2022 | $9,164 | $130,730 | $23,100 | $107,630 |
| 2021 | $9,237 | $130,730 | $23,100 | $107,630 |
| 2020 | $9,294 | $130,730 | $23,100 | $107,630 |
| 2019 | $8,972 | $120,930 | $23,100 | $97,830 |
| 2018 | $8,830 | $120,930 | $23,100 | $97,830 |
| 2017 | $8,541 | $109,900 | $18,690 | $91,210 |
| 2016 | $8,705 | $109,900 | $18,690 | $91,210 |
| 2015 | $8,317 | $108,470 | $18,690 | $89,780 |
| 2014 | -- | $108,470 | $18,690 | $89,780 |
| 2013 | $8,355 | $105,000 | $19,250 | $85,750 |
Source: Public Records
Map
Nearby Homes
- 764 Mill Crossing Dr
- 518 Kingfisher Dr
- 752 Kingsmead Rd Unit 18752
- 763 Kingsmead Rd
- 7356 Park Bend Dr
- 6867 Sherbrook Dr
- 6618 Wild Rose Ln
- 974 Lakeland Dr
- 6735 Alberta Place
- 7524 Center Green Dr
- 6460 Bromfield Dr
- 1182 Lake Point
- 1155 Ashford Ct
- 267 Windemere Place
- 200 Matthew Ave
- 1137 Hoover Lake Ct
- 203 N Hempstead Rd
- 8183 Chateau Ln
- 8357 Danbridge Way
- 7663 Rolling Ridge Way
- 636 High Timber Dr
- 644 High Timber Dr
- 628 High Timber Dr
- 635 Deer Trail
- 643 Deer Trail
- 627 Deer Trail
- 627 Deer Trail Dr
- 643 Deer Trail Dr
- 620 High Timber Dr
- 652 High Timber Dr
- 637 High Timber Dr
- 651 Deer Trail
- 629 High Timber Dr
- 619 Deer Trail
- 645 High Timber Dr
- 651 Deer Trail Dr
- 660 High Timber Dr
- 612 High Timber Dr
- 621 High Timber Dr
- 653 High Timber Dr