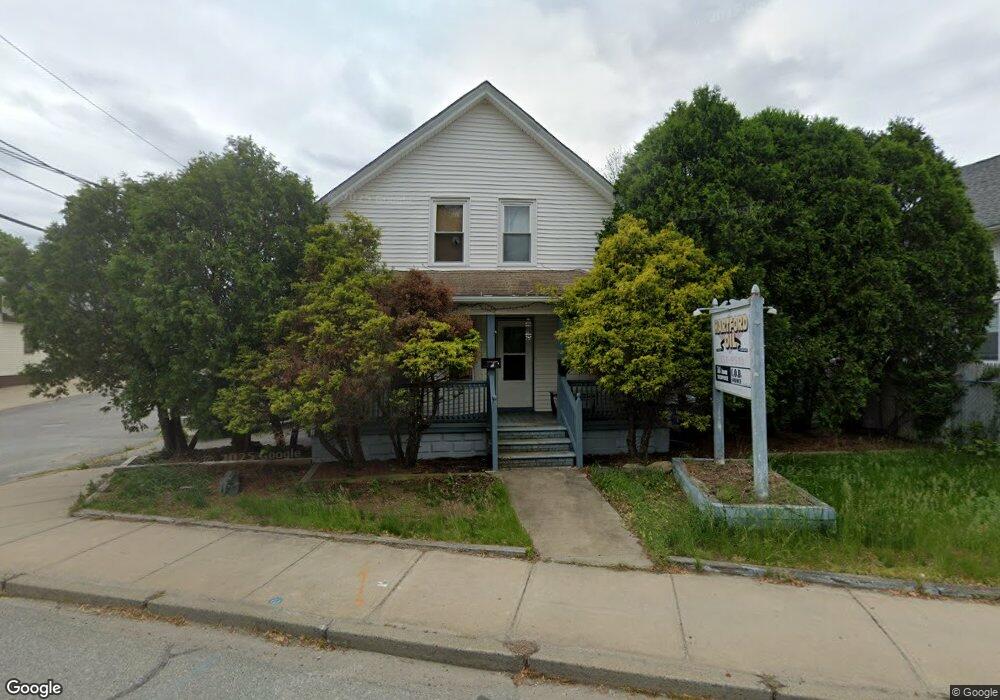
636 Killingly St Johnston, RI 02919
Hartford Avenue Neighborhood
4
Beds
2
Baths
2,859
Sq Ft
5,663
Sq Ft Lot
About This Home
This home is located at 636 Killingly St, Johnston, RI 02919. 636 Killingly St is a home located in Providence County with nearby schools including Johnston Senior High School, Trinity Academy for the Performing Arts, and St. Augustine School.
Ownership History
Date
Name
Owned For
Owner Type
Purchase Details
Closed on
Dec 13, 2019
Sold by
Adc Properties Llc
Bought by
Cassisi Realty Llc
Home Financials for this Owner
Home Financials are based on the most recent Mortgage that was taken out on this home.
Original Mortgage
$944,000
Outstanding Balance
$826,770
Interest Rate
3.7%
Mortgage Type
New Conventional
Purchase Details
Closed on
Nov 16, 2009
Sold by
Jp Morgan Chase Bk
Bought by
Adc Properties
Home Financials for this Owner
Home Financials are based on the most recent Mortgage that was taken out on this home.
Original Mortgage
$100,000
Interest Rate
4.98%
Mortgage Type
Commercial
Purchase Details
Closed on
Jul 17, 2009
Sold by
Decesaris Edward W and Jp Morgan Chase Bank N
Bought by
Jp Morgan Chase Bank N
Create a Home Valuation Report for This Property
The Home Valuation Report is an in-depth analysis detailing your home's value as well as a comparison with similar homes in the area
Home Values in the Area
Average Home Value in this Area
Purchase History
| Date | Buyer | Sale Price | Title Company |
|---|---|---|---|
| Cassisi Realty Llc | -- | None Available | |
| Cassisi Realty Llc | -- | None Available | |
| Adc Properties | $155,000 | -- | |
| Adc Properties | $155,000 | -- | |
| Jp Morgan Chase Bank N | $193,800 | -- | |
| Jp Morgan Chase Bank N | $193,800 | -- |
Source: Public Records
Mortgage History
| Date | Status | Borrower | Loan Amount |
|---|---|---|---|
| Open | Cassisi Realty Llc | $944,000 | |
| Closed | Cassisi Realty Llc | $944,000 | |
| Previous Owner | Jp Morgan Chase Bank N | $125,000 | |
| Previous Owner | Jp Morgan Chase Bank N | $100,000 |
Source: Public Records
Tax History
| Year | Tax Paid | Tax Assessment Tax Assessment Total Assessment is a certain percentage of the fair market value that is determined by local assessors to be the total taxable value of land and additions on the property. | Land | Improvement |
|---|---|---|---|---|
| 2025 | $3,496 | $223,800 | $115,600 | $108,200 |
| 2024 | $5,693 | $223,800 | $115,600 | $108,200 |
| 2023 | $5,693 | $223,800 | $115,600 | $108,200 |
| 2022 | $5,693 | $212,000 | $104,900 | $107,100 |
| 2021 | $0 | $212,000 | $104,900 | $107,100 |
| 2018 | $5,693 | $207,100 | $100,000 | $107,100 |
| 2016 | $7,532 | $207,100 | $100,000 | $107,100 |
| 2015 | $5,862 | $202,200 | $100,000 | $102,200 |
| 2014 | $5,813 | $202,200 | $100,000 | $102,200 |
| 2013 | $5,813 | $202,200 | $100,000 | $102,200 |
Source: Public Records
Map
Nearby Homes
- 638 Killingly St
- 635 Killingly St
- 644 Killingly St
- 646 Killingly St
- 634 Killingly St
- 633 Killingly St
- 1 Hunter Ave
- 630 Killingly St
- 645 Killingly St
- 16 Victor Ave
- 18 Victor Ave
- 3 Hunter Ave
- 629 Killingly St
- 6 Homestead Ave
- 5 Oakland Ave
- 22 Victor Ave
- 11 Victor Ave
- 13 Victor Ave
- 5 Hunter Ave
- 15 Victor Ave
Your Personal Tour Guide
Ask me questions while you tour the home.