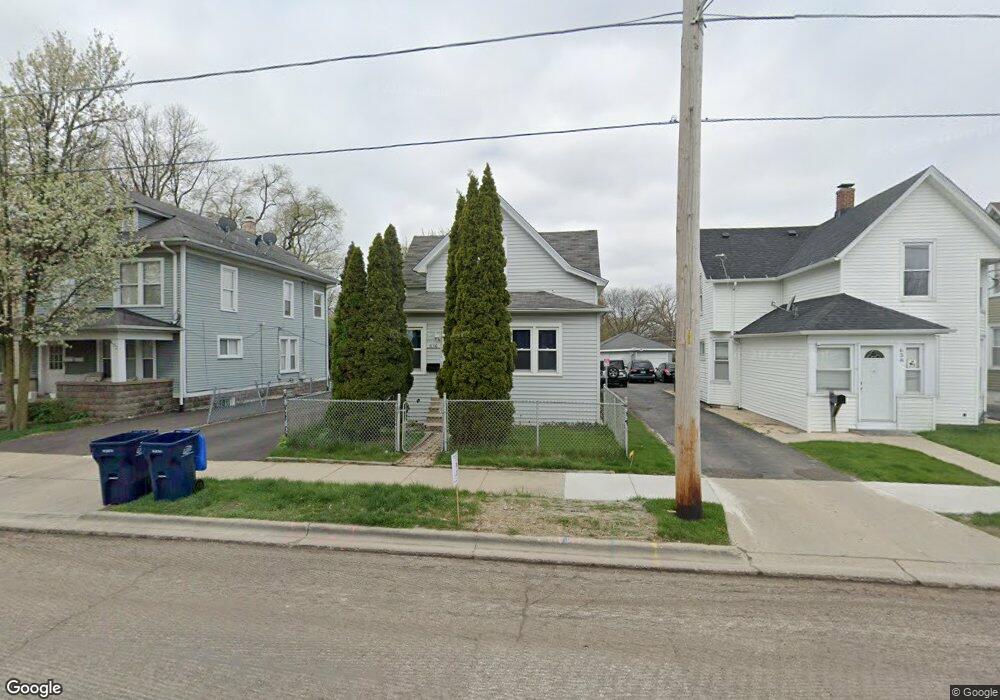
636 N Butrick St Waukegan, IL 60085
Pine Trail Estates NeighborhoodEstimated Value: $231,000 - $282,000
4
Beds
2
Baths
1,751
Sq Ft
$145/Sq Ft
Est. Value
About This Home
This home is located at 636 N Butrick St, Waukegan, IL 60085 and is currently estimated at $253,345, approximately $144 per square foot. 636 N Butrick St is a home located in Lake County with nearby schools including Hyde Park Elementary School, Miguel Juarez Middle School, and Waukegan High School.
Ownership History
Date
Name
Owned For
Owner Type
Purchase Details
Closed on
Apr 27, 2017
Sold by
Secretary Of Hud
Bought by
Brito Jessica
Current Estimated Value
Purchase Details
Closed on
Aug 15, 2016
Sold by
Bank Of America Na
Bought by
The Secretary Of Housing & Urban Develop
Purchase Details
Closed on
Jun 1, 2016
Sold by
Rivera Epifanio and Case #13 Ch 3322
Bought by
Bank Of America Na
Purchase Details
Closed on
Feb 11, 2002
Sold by
Paz Macarena and Ortiz Martin
Bought by
Rivera Epifanio
Home Financials for this Owner
Home Financials are based on the most recent Mortgage that was taken out on this home.
Original Mortgage
$113,150
Interest Rate
6.87%
Mortgage Type
FHA
Purchase Details
Closed on
Apr 22, 1995
Sold by
Faz Macarena and Ortiz Martin
Bought by
Faz Macarena and Ortiz Martin
Create a Home Valuation Report for This Property
The Home Valuation Report is an in-depth analysis detailing your home's value as well as a comparison with similar homes in the area
Home Values in the Area
Average Home Value in this Area
Purchase History
| Date | Buyer | Sale Price | Title Company |
|---|---|---|---|
| Brito Jessica | -- | First American Title Insuran | |
| The Secretary Of Housing & Urban Develop | -- | Oconnor Title Services Inc | |
| Bank Of America Na | -- | Premier Title | |
| Rivera Epifanio | $115,000 | Ticor Title | |
| Faz Macarena | -- | Chicago Title Insurance Co |
Source: Public Records
Mortgage History
| Date | Status | Borrower | Loan Amount |
|---|---|---|---|
| Previous Owner | Rivera Epifanio | $113,150 |
Source: Public Records
Tax History Compared to Growth
Tax History
| Year | Tax Paid | Tax Assessment Tax Assessment Total Assessment is a certain percentage of the fair market value that is determined by local assessors to be the total taxable value of land and additions on the property. | Land | Improvement |
|---|---|---|---|---|
| 2024 | $5,005 | $59,289 | $8,235 | $51,054 |
| 2023 | $4,502 | $53,082 | $7,373 | $45,709 |
| 2022 | $4,502 | $46,050 | $6,721 | $39,329 |
| 2021 | $4,319 | $41,423 | $6,330 | $35,093 |
| 2020 | $4,374 | $38,590 | $5,897 | $32,693 |
| 2019 | $4,403 | $35,362 | $5,404 | $29,958 |
| 2018 | $3,976 | $30,751 | $6,373 | $24,378 |
| 2017 | $3,870 | $27,206 | $5,638 | $21,568 |
| 2016 | $2,726 | $23,641 | $4,899 | $18,742 |
| 2015 | $2,561 | $21,159 | $4,385 | $16,774 |
| 2014 | $2,995 | $23,688 | $3,577 | $20,111 |
| 2012 | $4,026 | $25,665 | $3,876 | $21,789 |
Source: Public Records
Map
Nearby Homes
- 824 N Butrick St
- 1109 Massena Ave
- 917 N Linden Ave
- 1000 Pine St
- 968 Judge Ave
- 1213 Grand Ave
- 511 Chestnut St
- 522 N Poplar St
- 620 N Poplar St
- 702 Franklin St
- 428 N Poplar St
- 1005 N Lewis Ave
- 1023 N Elmwood Ave
- 1117 Judge Ave
- 1019 N Lewis Ave
- 1038 Indiana Ave
- 1105 Woodlawn Cir
- 2115 Lydia St
- 1416 Hamilton Ct
- 615 Tiffany Dr
- 638 N Butrick St
- 632 N Butrick St
- 642 N Butrick St
- 628 N Butrick St
- 646 N Butrick St
- 641 Yeoman St
- 645 Yeoman St
- 637 Yeoman St
- 626 N Butrick St
- 649 Yeoman St
- 633 Yeoman St
- 629 Yeoman St
- 627 N Butrick St
- 1321 Grand Ave
- 661 Yeoman St Unit L2
- 661 Yeoman St Unit U4
- 661 Yeoman St Unit U1
- 1315 Grand Ave
- 618 N Butrick St
- 627 Yeoman St