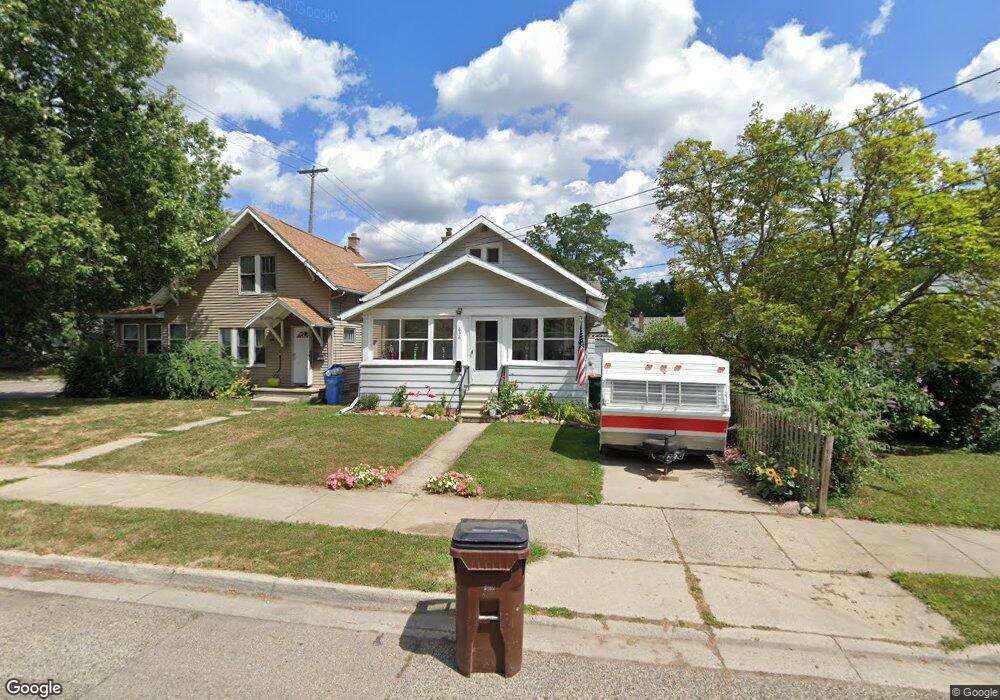
636 N Magnolia Ave Lansing, MI 48912
Foster NeighborhoodEstimated Value: $96,034 - $124,000
3
Beds
2
Baths
748
Sq Ft
$146/Sq Ft
Est. Value
About This Home
This home is located at 636 N Magnolia Ave, Lansing, MI 48912 and is currently estimated at $109,509, approximately $146 per square foot. 636 N Magnolia Ave is a home located in Ingham County with nearby schools including Pattengill Academy, Riddle Elementary School, and Eastern Lansing High School.
Ownership History
Date
Name
Owned For
Owner Type
Purchase Details
Closed on
May 6, 2011
Sold by
Bac Home Loans Servicing Lp
Bought by
Spitzley Michael
Current Estimated Value
Purchase Details
Closed on
Jul 29, 2010
Sold by
Magistro Dan
Bought by
Bac Home Loans Servicing Lp
Purchase Details
Closed on
Sep 2, 2004
Sold by
Dunbar Fawn L
Bought by
Magistro Dan
Home Financials for this Owner
Home Financials are based on the most recent Mortgage that was taken out on this home.
Original Mortgage
$70,000
Interest Rate
5.95%
Mortgage Type
New Conventional
Purchase Details
Closed on
Jun 16, 1999
Sold by
Dunbar Victor L
Bought by
Dunbar Fawn L
Purchase Details
Closed on
Jun 1, 1992
Create a Home Valuation Report for This Property
The Home Valuation Report is an in-depth analysis detailing your home's value as well as a comparison with similar homes in the area
Home Values in the Area
Average Home Value in this Area
Purchase History
| Date | Buyer | Sale Price | Title Company |
|---|---|---|---|
| Spitzley Michael | $32,500 | Thoroughbred Title Agency | |
| Bac Home Loans Servicing Lp | $30,000 | None Available | |
| Magistro Dan | $87,500 | Mids | |
| Dunbar Fawn L | -- | -- | |
| Dunbar Fawn L | -- | -- | |
| -- | $40,900 | -- |
Source: Public Records
Mortgage History
| Date | Status | Borrower | Loan Amount |
|---|---|---|---|
| Previous Owner | Magistro Dan | $70,000 |
Source: Public Records
Tax History Compared to Growth
Tax History
| Year | Tax Paid | Tax Assessment Tax Assessment Total Assessment is a certain percentage of the fair market value that is determined by local assessors to be the total taxable value of land and additions on the property. | Land | Improvement |
|---|---|---|---|---|
| 2025 | $1,853 | $31,600 | $5,800 | $25,800 |
| 2024 | $15 | $29,300 | $5,800 | $23,500 |
| 2023 | $1,746 | $27,100 | $5,800 | $21,300 |
| 2022 | $1,597 | $25,200 | $4,900 | $20,300 |
| 2021 | $1,560 | $23,400 | $4,900 | $18,500 |
| 2020 | $1,549 | $22,400 | $4,900 | $17,500 |
| 2019 | $1,494 | $21,500 | $4,900 | $16,600 |
| 2018 | $1,419 | $20,200 | $4,900 | $15,300 |
| 2017 | $1,364 | $20,200 | $4,900 | $15,300 |
| 2016 | $1,310 | $18,500 | $4,900 | $13,600 |
| 2015 | $1,310 | $17,800 | $9,708 | $8,092 |
| 2014 | $1,310 | $16,900 | $6,795 | $10,105 |
Source: Public Records
Map
Nearby Homes
- 628 N Magnolia Ave
- 623 N Magnolia Ave
- 811 N Foster Ave
- 435 N Magnolia Ave
- 422 N Magnolia Ave
- 417 N Francis Ave
- 318 N Foster Ave
- 825 Merrill Ave
- 324 N Francis Ave
- 212 N Fairview Ave
- 204 N Fairview Ave
- 1226 N Hayford Ave
- 221 N Francis Ave
- 1043 Kimberly Dr Unit 11
- 2635 Lasalle Blvd
- 1423 Academy Ln
- 2808 Lasalle Gardens
- 941 Maryland Ave
- 2711 Lasalle Blvd
- 1408 E Oakland Ave
- 640 N Magnolia Ave
- 630 N Magnolia Ave
- 2212 E Saginaw St
- 624 N Magnolia Ave
- 633 N Hayford Ave
- 637 N Hayford Ave
- 639 N Hayford Ave
- 629 N Hayford Ave
- 622 N Magnolia Ave
- 702 N Magnolia Ave
- 637 N Magnolia Ave
- 625 N Hayford Ave
- 635 N Magnolia Ave
- 641 N Magnolia Ave
- 631 N Magnolia Ave
- 703 N Hayford Ave
- 629 N Magnolia Ave
- 623 N Hayford Ave
- 625 N Magnolia Ave
- 612 N Magnolia Ave