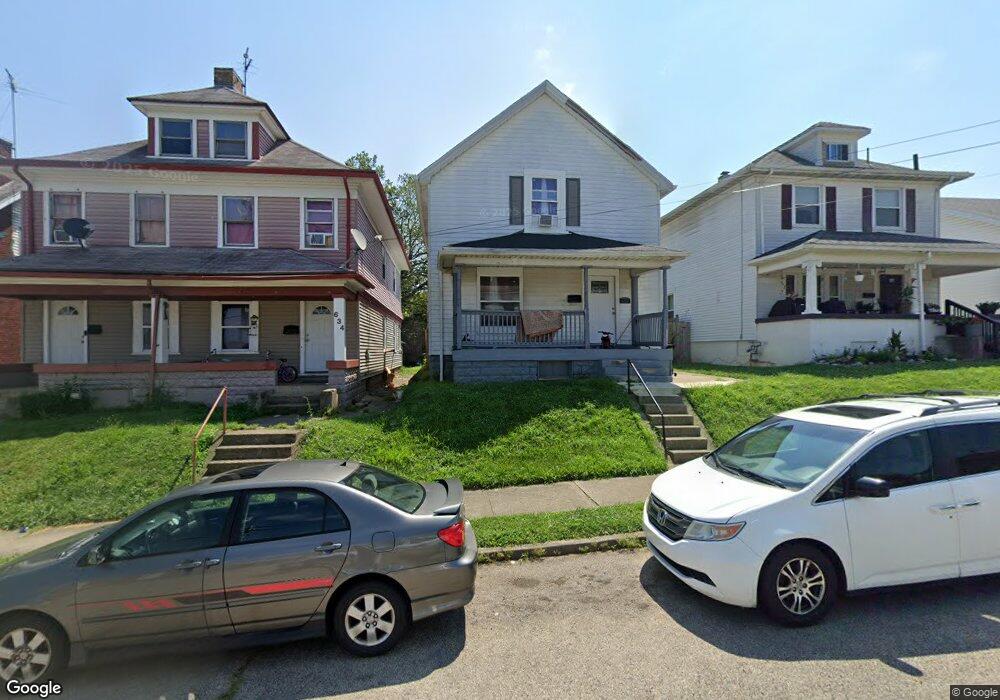
636 Pritz Ave Dayton, OH 45410
Linden Heights NeighborhoodEstimated Value: $133,000 - $151,000
3
Beds
2
Baths
1,457
Sq Ft
$99/Sq Ft
Est. Value
About This Home
This home is located at 636 Pritz Ave, Dayton, OH 45410 and is currently estimated at $143,937, approximately $98 per square foot. 636 Pritz Ave is a home located in Montgomery County with nearby schools including Cleveland Elementary School, Horace Mann Elementary School, and Eastmont Elementary.
Ownership History
Date
Name
Owned For
Owner Type
Purchase Details
Closed on
Dec 10, 2019
Sold by
Cci Oh Reo Llc
Bought by
Paragon Solutions Construction Llc
Current Estimated Value
Purchase Details
Closed on
Jan 22, 2019
Sold by
Tax Ease Funding 2016 1 Reo Llc
Bought by
Cc1 Oh Reo Llc
Purchase Details
Closed on
Sep 4, 2018
Sold by
Tax Ease Ohio Llc
Bought by
Tax Ease Funding 2016 1 Reo Llc
Purchase Details
Closed on
Jun 11, 2018
Sold by
Svoboda David F
Bought by
Tax Ease Ohio Llc
Purchase Details
Closed on
Sep 23, 2008
Sold by
Bt Investments Llc
Bought by
Svoboda David F
Purchase Details
Closed on
Dec 8, 2004
Sold by
Sexton William Vincent
Bought by
Bt Investments Llc
Purchase Details
Closed on
Jan 24, 2001
Sold by
Sexton Juanita Karen
Bought by
Sexton William Vincent
Create a Home Valuation Report for This Property
The Home Valuation Report is an in-depth analysis detailing your home's value as well as a comparison with similar homes in the area
Home Values in the Area
Average Home Value in this Area
Purchase History
| Date | Buyer | Sale Price | Title Company |
|---|---|---|---|
| Paragon Solutions Construction Llc | $16,000 | Fidelity Lawyers Ttl Agcy Ll | |
| Cc1 Oh Reo Llc | -- | None Available | |
| Tax Ease Funding 2016 1 Reo Llc | -- | None Available | |
| Tax Ease Ohio Llc | -- | None Available | |
| Svoboda David F | $1,100 | Multiple | |
| Bt Investments Llc | $30,100 | None Available | |
| Sexton William Vincent | -- | -- |
Source: Public Records
Tax History Compared to Growth
Tax History
| Year | Tax Paid | Tax Assessment Tax Assessment Total Assessment is a certain percentage of the fair market value that is determined by local assessors to be the total taxable value of land and additions on the property. | Land | Improvement |
|---|---|---|---|---|
| 2024 | $2,241 | $38,910 | $6,880 | $32,030 |
| 2023 | $2,241 | $38,910 | $6,880 | $32,030 |
| 2022 | $1,911 | $25,610 | $4,530 | $21,080 |
| 2021 | $1,900 | $25,610 | $4,530 | $21,080 |
| 2020 | $1,897 | $25,610 | $4,530 | $21,080 |
| 2019 | $2,467 | $20,030 | $3,240 | $16,790 |
| 2018 | $1,646 | $20,030 | $3,240 | $16,790 |
| 2017 | $1,634 | $20,030 | $3,240 | $16,790 |
| 2016 | $1,603 | $19,190 | $3,240 | $15,950 |
| 2015 | $1,516 | $19,190 | $3,240 | $15,950 |
| 2014 | $1,516 | $19,190 | $3,240 | $15,950 |
| 2012 | -- | $16,150 | $5,040 | $11,110 |
Source: Public Records
Map
Nearby Homes
- 624 Pritz Ave
- 708 Saint Nicholas Ave
- 722 Saint Nicholas Ave
- 621 Creighton Ave
- 1018 Haviland Ave
- 1024 Haviland Ave
- 1609 Xenia Ave
- 626 Creighton Ave
- 630 Hulbert St
- 607 Carlisle Ave
- 1000 Xenia Ave
- 1708 Xenia Ave
- 523 Carlisle Ave
- 630 Carlisle Ave
- 662 Carlisle Ave
- 800 Linden Ave
- 2012 Saint Charles Ave
- 853 Carlisle Ave
- 716 Hodapp Ave
- 914 Linden Ave
- 640 Pritz Ave
- 634 Pritz Ave
- 632 Pritz Ave
- 648 Pritz Ave
- 630 Pritz Ave
- 650 Pritz Ave
- 654 Pritz Ave
- 1625 Tacoma St
- 635 Pritz Ave Unit 635 Pritz Ave
- 658 Pritz Ave
- 622 Pritz Ave
- 633 Pritz Ave
- 639 Pritz Ave
- 643 Pritz Ave
- 618 Pritz Ave Unit TOP
- 618 Pritz Ave
- 647 Pritz Ave
- 651 Pritz Ave
- 612 Pritz Ave
- 639 Saint Nicholas Ave