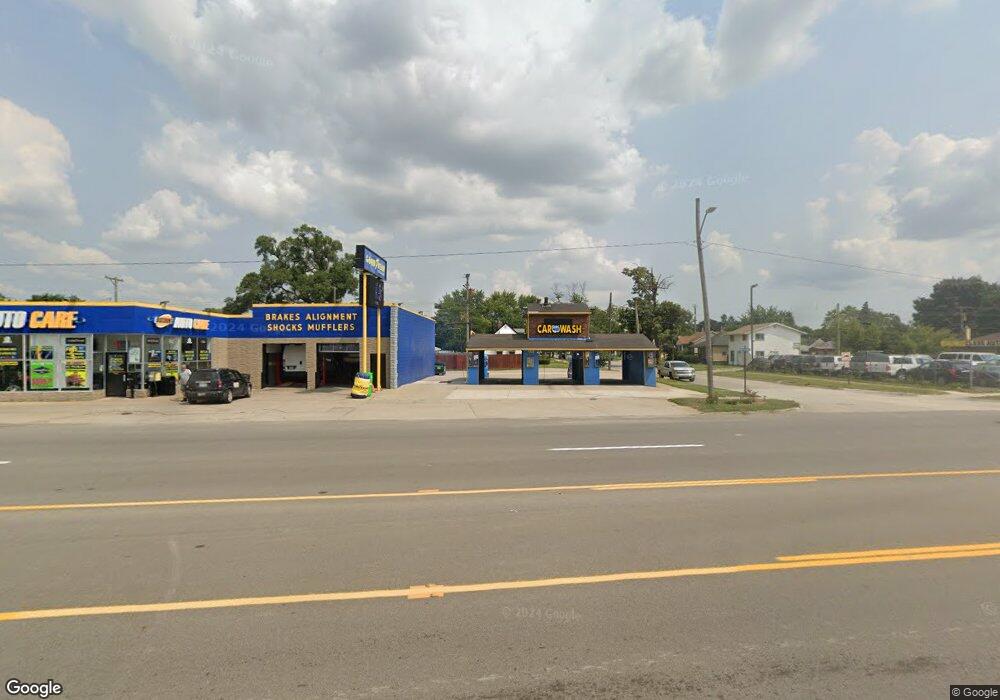
636 Southfield Rd Lincoln Park, MI 48146
Estimated Value: $135,354
--
Bed
--
Bath
984
Sq Ft
$138/Sq Ft
Est. Value
About This Home
This home is located at 636 Southfield Rd, Lincoln Park, MI 48146 and is currently estimated at $135,354, approximately $137 per square foot. 636 Southfield Rd is a home located in Wayne County with nearby schools including Raupp Elementary School, Lincoln Park Middle School, and Lincoln Park High School.
Ownership History
Date
Name
Owned For
Owner Type
Purchase Details
Closed on
May 11, 2023
Sold by
Manning Cecil
Bought by
Prestige Global Worldwide Llc
Current Estimated Value
Purchase Details
Closed on
May 3, 2022
Sold by
Abdulhassan Karkash Muslim
Bought by
Manning Cecil
Purchase Details
Closed on
Jun 29, 2020
Sold by
Robert Adams James
Bought by
Karkash Muslim Abdulhassan
Purchase Details
Closed on
Dec 10, 2015
Sold by
Cj Stamp Lc
Bought by
Adams James Robert and Mclaughlin Robert Dennis
Purchase Details
Closed on
Mar 17, 2015
Sold by
Sawyer Bros Holdings Llc
Bought by
C J Stamp Lc and C J Stamp Llc
Purchase Details
Closed on
Feb 19, 2014
Sold by
C J Stamp Lc
Bought by
Sawyer Bros Holdings Llc
Purchase Details
Closed on
Feb 13, 2014
Sold by
Lincoln Park Wash All Inc
Bought by
C J Stamp Lc and C J Staml Llc
Purchase Details
Closed on
Jan 16, 1997
Sold by
Carol A and Burns George A
Bought by
Cj Stamp
Create a Home Valuation Report for This Property
The Home Valuation Report is an in-depth analysis detailing your home's value as well as a comparison with similar homes in the area
Home Values in the Area
Average Home Value in this Area
Purchase History
| Date | Buyer | Sale Price | Title Company |
|---|---|---|---|
| Prestige Global Worldwide Llc | -- | None Listed On Document | |
| Manning Cecil | $115,000 | Title One | |
| Karkash Muslim Abdulhassan | $55,000 | First American Title | |
| Adams James Robert | $29,900 | First American Title Ins Co | |
| Adams James Robert | -- | First American Title Ins Co | |
| C J Stamp Lc | -- | None Available | |
| Sawyer Bros Holdings Llc | -- | None Available | |
| C J Stamp Lc | -- | None Available | |
| Cj Stamp | $110,000 | -- |
Source: Public Records
Tax History Compared to Growth
Tax History
| Year | Tax Paid | Tax Assessment Tax Assessment Total Assessment is a certain percentage of the fair market value that is determined by local assessors to be the total taxable value of land and additions on the property. | Land | Improvement |
|---|---|---|---|---|
| 2025 | $2,466 | $41,100 | $0 | $0 |
| 2024 | $2,466 | $40,000 | $0 | $0 |
| 2023 | $2,428 | $39,500 | $0 | $0 |
| 2022 | $2,664 | $37,000 | $0 | $0 |
| 2021 | $2,648 | $36,500 | $0 | $0 |
| 2020 | $2,737 | $37,600 | $0 | $0 |
| 2019 | $2,355 | $37,900 | $0 | $0 |
| 2018 | $2,546 | $43,500 | $0 | $0 |
| 2017 | $1,247 | $43,500 | $0 | $0 |
| 2016 | $3,018 | $42,100 | $0 | $0 |
| 2015 | $4,320 | $43,200 | $0 | $0 |
| 2013 | $3,364 | $45,000 | $0 | $0 |
| 2012 | $2,179 | $45,000 | $13,000 | $32,000 |
Source: Public Records
Map
Nearby Homes
- 1581 Empire Ave
- 650 Cleophus Pkwy
- 1529 Grant Ave
- 1459 Pingree Ave
- 776 Cleophus Pkwy
- 637 Park Ave
- 1363 Empire Ave
- 764 White Ave
- 557 White Ave
- 568 Garfield Ave
- 1321 Applewood Ave
- 615 Garfield Ave
- 1622 Wilson Ave
- 880 White Ave
- 485 Garfield Ave
- 1375 Wilson Ave
- 1257 Applewood Ave
- 1673 Ferris Ave
- 881 Garfield Ave
- 4345 10th St
- 1618 Applewood Ave
- 664 Southfield Rd
- 1614 Applewood Ave
- 1619 Pingree Ave
- 1615 Pingree Ave
- 1606 Applewood Ave
- 1609 Pingree Ave
- 625 Southfield Rd
- 1617 Applewood Ave
- 1605 Pingree Ave
- 1607 Applewood Ave
- 1594 Applewood Ave
- 590 Southfield Rd
- 634 Cleophus Pkwy
- 642 Cleophus Pkwy
- 622 Cleophus Pkwy
- 1590 Applewood Ave
- 630 Cleophus Pkwy
- 654 Cleophus Pkwy
- 1620 Pingree Ave