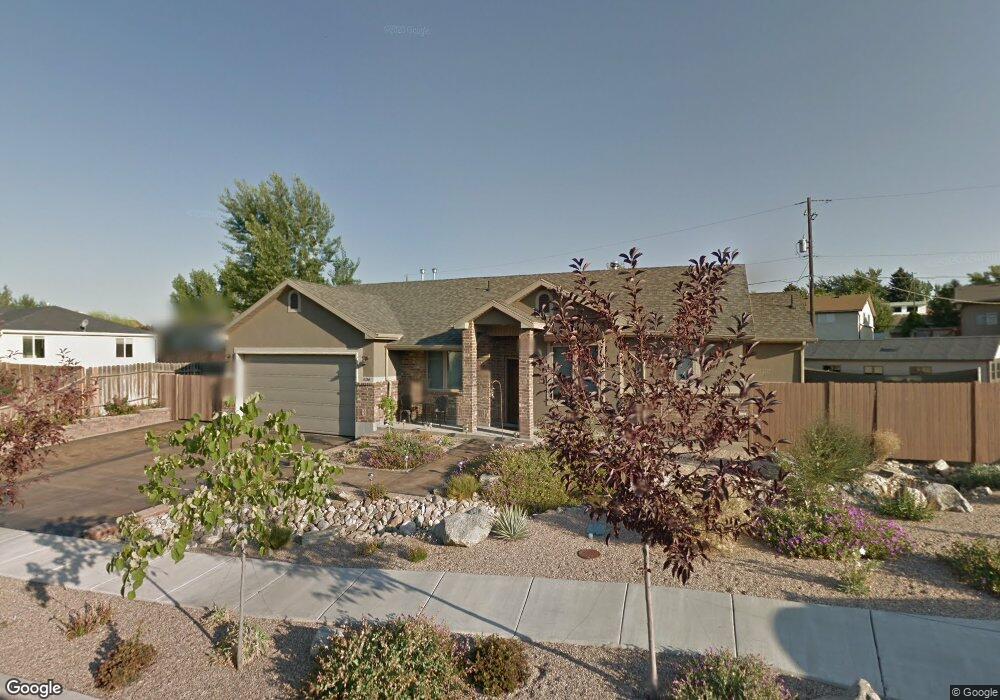
636 W 2350 N Unit 511 Layton, UT 84041
Estimated Value: $483,021 - $529,000
2
Beds
2
Baths
1,564
Sq Ft
$321/Sq Ft
Est. Value
About This Home
This home is located at 636 W 2350 N Unit 511, Layton, UT 84041 and is currently estimated at $502,755, approximately $321 per square foot. 636 W 2350 N Unit 511 is a home located in Davis County with nearby schools including Lincoln Elementary School, North Layton Junior High School, and Northridge High School.
Ownership History
Date
Name
Owned For
Owner Type
Purchase Details
Closed on
Jun 30, 2016
Sold by
Wilson Marlene S
Bought by
Smith Jason R
Current Estimated Value
Home Financials for this Owner
Home Financials are based on the most recent Mortgage that was taken out on this home.
Original Mortgage
$233,689
Outstanding Balance
$186,795
Interest Rate
3.62%
Mortgage Type
FHA
Estimated Equity
$315,960
Purchase Details
Closed on
Mar 2, 2016
Sold by
Wiser Richard V and Wiser Helma S
Bought by
Wiser Richard V and Wiser Helma S
Purchase Details
Closed on
Oct 24, 2005
Sold by
Prince Development Llc
Bought by
Wilson Neldon G and Wilson Marlene S
Create a Home Valuation Report for This Property
The Home Valuation Report is an in-depth analysis detailing your home's value as well as a comparison with similar homes in the area
Home Values in the Area
Average Home Value in this Area
Purchase History
| Date | Buyer | Sale Price | Title Company |
|---|---|---|---|
| Smith Jason R | -- | Us Title | |
| Wiser Richard V | -- | None Available | |
| Wilson Neldon G | -- | Utah Commercial Title Co |
Source: Public Records
Mortgage History
| Date | Status | Borrower | Loan Amount |
|---|---|---|---|
| Open | Smith Jason R | $233,689 |
Source: Public Records
Tax History Compared to Growth
Tax History
| Year | Tax Paid | Tax Assessment Tax Assessment Total Assessment is a certain percentage of the fair market value that is determined by local assessors to be the total taxable value of land and additions on the property. | Land | Improvement |
|---|---|---|---|---|
| 2024 | $2,216 | $234,300 | $126,583 | $107,717 |
| 2023 | $2,210 | $412,000 | $146,529 | $265,471 |
| 2022 | $2,309 | $233,750 | $78,647 | $155,103 |
| 2021 | $2,180 | $329,000 | $113,494 | $215,506 |
| 2020 | $1,989 | $288,000 | $94,152 | $193,848 |
| 2019 | $1,946 | $276,000 | $88,215 | $187,785 |
| 2018 | $1,770 | $252,000 | $88,215 | $163,785 |
| 2016 | $1,658 | $121,770 | $29,049 | $92,721 |
| 2015 | $1,694 | $118,140 | $29,049 | $89,091 |
| 2014 | $1,671 | $119,136 | $29,049 | $90,087 |
| 2013 | -- | $109,298 | $26,884 | $82,414 |
Source: Public Records
Map
Nearby Homes
- 2378 N 675 W
- 2402 N 725 W
- 2211 N 525 W
- 781 W 2150 N
- 2187 N 450 W
- 2875 N Hill Field Rd Unit 58
- 2875 N Hill Field Rd Unit 17
- 2875 N Hill Field Rd Unit 62
- 2600 N Hill Field Rd Unit 4
- 2600 N Hill Field Rd Unit 138
- 65 Sunset Dr
- 63 Sunset Dr
- 709 W Highway 193
- 2500 N Fort Ln Unit 238
- 2500 N Fort Ln Unit 189
- 14 Lakeview Dr
- 121 Barrington Way
- 86 Atherton Way
- 85 Atherton Way
- 129 Barrington Way
- 636 W 2350 N
- 636 W 2350 N Unit 636
- 583 W 2400 N
- 577 W 2400 N
- 591 W 2400 N
- 668 W 2350 N
- 2368 N 675 W
- 641 W 2350 N
- 641 W 2350 N Unit 501
- 629 W 2350 N
- 629 W 2350 N Unit 502
- 617 W 2350 N
- 617 W 2350 N Unit 503
- 663 W 2350 N
- 565 W 2400 N
- 603 W 2350 N
- 603 W 2350 N Unit 504
- 2346 N 675 W
- 553 W 2400 N
- 595 W 2350 N Unit 505+