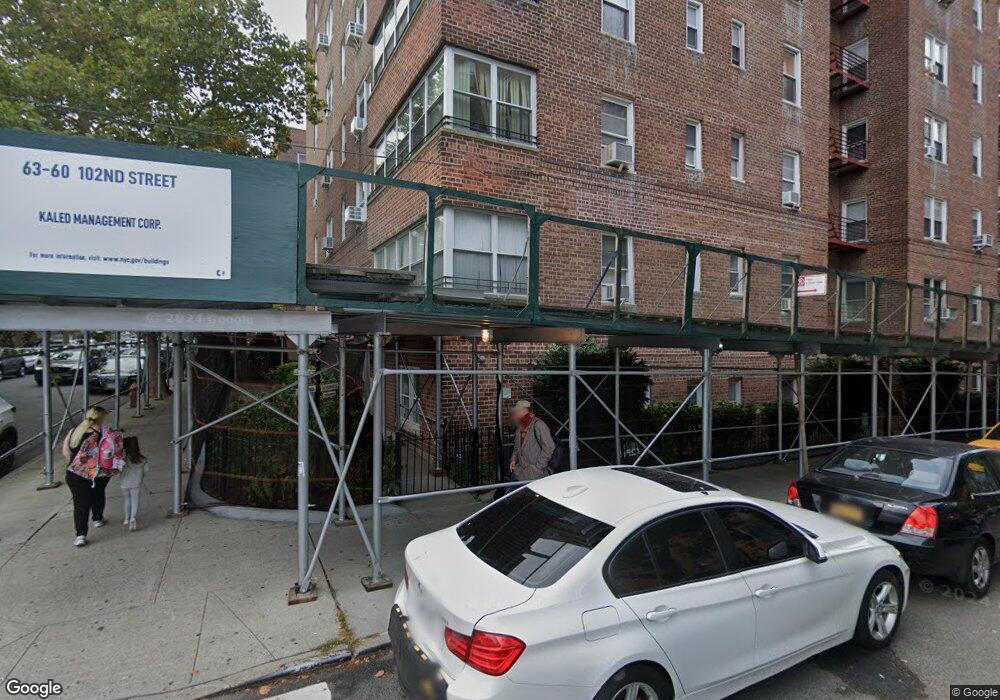
New Hampshire House Condos 6360 102nd St Unit D 23 Rego Park, NY 11374
Rego Park NeighborhoodEstimated Value: $337,000 - $468,000
1
Bed
1
Bath
780
Sq Ft
$538/Sq Ft
Est. Value
About This Home
This home is located at 6360 102nd St Unit D 23, Rego Park, NY 11374 and is currently estimated at $419,716, approximately $538 per square foot. 6360 102nd St Unit D 23 is a home located in Queens County with nearby schools including P.S. 175 - The Lynn Gross Discovery School, Stephen A. Halsey JHS 157, and Valence College Preparatory Charter School.
Ownership History
Date
Name
Owned For
Owner Type
Purchase Details
Closed on
Apr 27, 2023
Sold by
Ribiev Ester
Bought by
Rahman Razia
Current Estimated Value
Home Financials for this Owner
Home Financials are based on the most recent Mortgage that was taken out on this home.
Original Mortgage
$130,000
Outstanding Balance
$126,405
Interest Rate
6.42%
Mortgage Type
Purchase Money Mortgage
Estimated Equity
$293,311
Purchase Details
Closed on
Aug 6, 2014
Sold by
Ribiev Boris and Ribiev Ester
Bought by
Ribiev Ester
Purchase Details
Closed on
Apr 27, 2006
Sold by
Boker Realty Inc
Bought by
Ribiev Boris and Ribiev Ester
Home Financials for this Owner
Home Financials are based on the most recent Mortgage that was taken out on this home.
Original Mortgage
$150,000
Interest Rate
6.42%
Mortgage Type
Purchase Money Mortgage
Create a Home Valuation Report for This Property
The Home Valuation Report is an in-depth analysis detailing your home's value as well as a comparison with similar homes in the area
Home Values in the Area
Average Home Value in this Area
Purchase History
| Date | Buyer | Sale Price | Title Company |
|---|---|---|---|
| Rahman Razia | $460,000 | -- | |
| Ribiev Ester | -- | -- | |
| Ribiev Boris | $250,000 | -- |
Source: Public Records
Mortgage History
| Date | Status | Borrower | Loan Amount |
|---|---|---|---|
| Open | Rahman Razia | $130,000 | |
| Previous Owner | Ribiev Boris | $150,000 |
Source: Public Records
Tax History Compared to Growth
Tax History
| Year | Tax Paid | Tax Assessment Tax Assessment Total Assessment is a certain percentage of the fair market value that is determined by local assessors to be the total taxable value of land and additions on the property. | Land | Improvement |
|---|---|---|---|---|
| 2025 | $4,153 | $33,361 | $2,454 | $30,907 |
| 2024 | $4,153 | $33,222 | $2,454 | $30,768 |
| 2023 | $4,126 | $32,999 | $2,454 | $30,545 |
| 2022 | $2,847 | $32,369 | $2,454 | $29,915 |
| 2021 | $2,975 | $33,727 | $2,454 | $31,273 |
| 2020 | $2,413 | $39,003 | $2,454 | $36,549 |
| 2019 | $2,828 | $35,374 | $2,454 | $32,920 |
| 2018 | $3,637 | $28,596 | $2,455 | $26,141 |
| 2017 | $3,264 | $25,664 | $2,454 | $23,210 |
| 2016 | $3,005 | $25,664 | $2,454 | $23,210 |
| 2015 | $1,676 | $21,106 | $2,454 | $18,652 |
| 2014 | $1,676 | $19,487 | $2,455 | $17,032 |
Source: Public Records
About New Hampshire House Condos
Map
Nearby Homes
- 6360 102nd St Unit A18
- 63-60 102nd St Unit D9
- 63-60 102nd St Unit B14
- 63-60 102nd St Unit D8
- 63-60 102nd St Unit D11
- 63-60 102nd St Unit D7
- 99-41 64th Ave Unit B17
- 9941 64th Ave Unit F12
- 99-60 63 Rd Unit 14E
- 99-60 63rd Rd Unit 3
- 99-60 63rd Rd Unit 1B
- 99-60 63rd Rd Unit 5W
- 102-18 64th Ave Unit 2L
- 102-18 64th Ave Unit 2X
- 64-05 102nd St
- 99-31 64th Ave Unit E9
- 99-31 64th Ave Unit C11
- 99-31 64th Ave Unit 7
- 99-40 63rd Rd Unit 1-O
- 99-40 63rd Rd Unit 9Z
- 6360 102nd St Unit B19
- 6360 102nd St Unit D8
- 6360 102nd St Unit 6-F
- 6360 102nd St Unit 3rd Fl
- 6360 102nd St Unit E1
- 6360 102nd St Unit A15
- 6360 102nd St Unit C5
- 6360 102nd St Unit G20
- 6360 102nd St Unit G22
- 6360 102nd St Unit B3
- 6360 102nd St Unit B21
- 6360 102nd St Unit D4
- 6360 102nd St Unit B22
- 6360 102nd St Unit B6
- 6360 102nd St Unit E10
- 6360 102nd St Unit E11
- 6360 102nd St Unit 5th fl
- 6360 102nd St
- 6360 102nd St Unit A22
- 6360 102nd St Unit D12