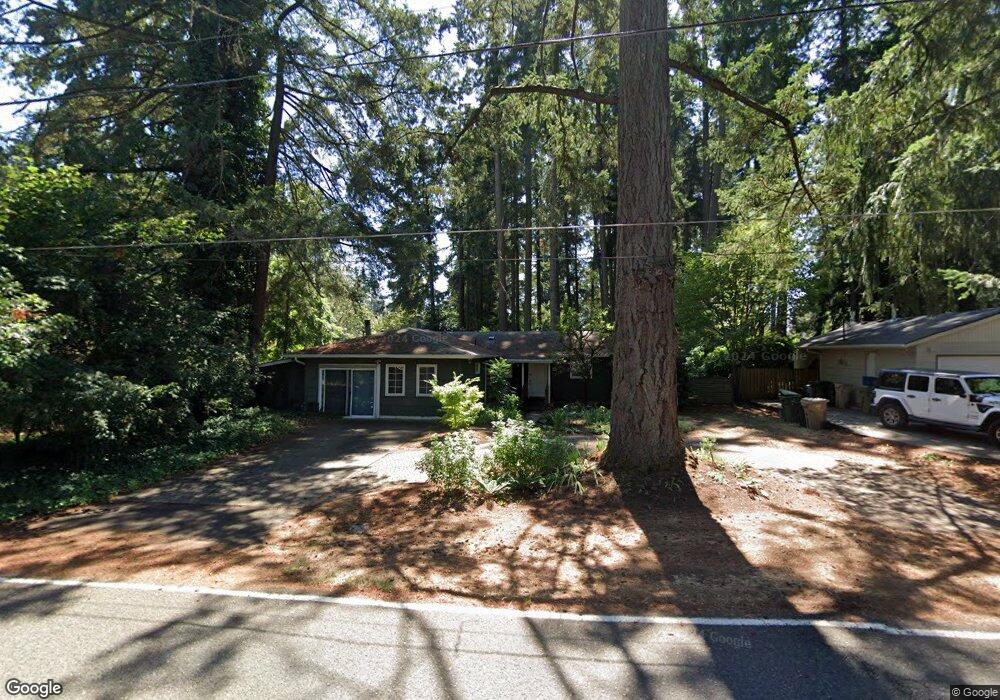
6360 Mcewan Rd Lake Oswego, OR 97035
Rosewood NeighborhoodEstimated Value: $606,129 - $628,000
3
Beds
2
Baths
1,450
Sq Ft
$424/Sq Ft
Est. Value
About This Home
This home is located at 6360 Mcewan Rd, Lake Oswego, OR 97035 and is currently estimated at $615,282, approximately $424 per square foot. 6360 Mcewan Rd is a home located in Clackamas County with nearby schools including River Grove Elementary School, Lakeridge Middle School, and Lakeridge High School.
Ownership History
Date
Name
Owned For
Owner Type
Purchase Details
Closed on
Jun 6, 2018
Sold by
Le Albert
Bought by
Le Diem
Current Estimated Value
Purchase Details
Closed on
Feb 5, 2018
Sold by
Lee Albert
Bought by
Le Diem and Le Albert
Purchase Details
Closed on
Sep 9, 2014
Sold by
Fannie Mae
Bought by
Le Albert
Purchase Details
Closed on
Jun 20, 2012
Sold by
Riley Eileen
Bought by
Federal National Mortgage Association
Purchase Details
Closed on
Jan 19, 2004
Sold by
Riley Eileen
Bought by
Riley Eileen and Riley John William
Purchase Details
Closed on
Aug 16, 2002
Sold by
Shroyer Gregory D and Shroyer Dale L
Bought by
Riley Eileen
Home Financials for this Owner
Home Financials are based on the most recent Mortgage that was taken out on this home.
Original Mortgage
$185,000
Interest Rate
6.52%
Purchase Details
Closed on
May 27, 1997
Sold by
Meeker Mark David and Meeker Ellen Mary
Bought by
Shroyer Gregory D and Shroyer Dale L
Create a Home Valuation Report for This Property
The Home Valuation Report is an in-depth analysis detailing your home's value as well as a comparison with similar homes in the area
Home Values in the Area
Average Home Value in this Area
Purchase History
| Date | Buyer | Sale Price | Title Company |
|---|---|---|---|
| Le Diem | -- | None Available | |
| Le Diem | -- | None Available | |
| Le Albert | $260,000 | Chicago Title Company | |
| Federal National Mortgage Association | $167,100 | Fatco | |
| Riley Eileen | -- | -- | |
| Riley Eileen | $185,000 | Fidelity National Title Co | |
| Shroyer Gregory D | $125,000 | Oregon Title Insurance Co |
Source: Public Records
Mortgage History
| Date | Status | Borrower | Loan Amount |
|---|---|---|---|
| Previous Owner | Riley Eileen | $185,000 |
Source: Public Records
Tax History Compared to Growth
Tax History
| Year | Tax Paid | Tax Assessment Tax Assessment Total Assessment is a certain percentage of the fair market value that is determined by local assessors to be the total taxable value of land and additions on the property. | Land | Improvement |
|---|---|---|---|---|
| 2024 | $4,750 | $272,751 | -- | -- |
| 2023 | $4,750 | $264,807 | $0 | $0 |
| 2022 | $4,481 | $257,095 | $0 | $0 |
| 2021 | $4,107 | $249,607 | $0 | $0 |
| 2020 | $4,003 | $242,337 | $0 | $0 |
| 2019 | $4,038 | $235,279 | $0 | $0 |
| 2018 | $3,757 | $228,426 | $0 | $0 |
| 2017 | $3,621 | $221,773 | $0 | $0 |
| 2016 | $3,406 | $215,314 | $0 | $0 |
| 2015 | $3,141 | $209,043 | $0 | $0 |
| 2014 | $2,814 | $174,603 | $0 | $0 |
Source: Public Records
Map
Nearby Homes
- 6401 Mcewan Rd
- 18543 Don Lee Way
- 18411 Longfellow Ave
- 18515 Kristi Way
- 5455 Childs Rd
- 5650 Lakeview Blvd
- 18021 Tualata Ave
- 18581 Timbergrove Ct
- 19368 Riverwood Ln
- 5225 Jean Rd Unit 307
- 5225 Jean Rd Unit 606
- 7151 SW Sagert St Unit 101
- 7165 SW Sagert St Unit 107
- 6244 Frost Ln
- 18863 Indian Springs Rd
- 5966 Frost Ln
- 7143 SW Sagert St Unit 104
- 17230 SW Rivendell Dr
- 19130 SW 51st Ave
- 16461 SW Cambridge Ln
- 6400 Mcewan Rd
- 6340 Mcewan Rd
- 6267 Wayzata Ct
- 6430 Mcewan Rd
- 6306 Mcewan Rd
- 18850 65th Ave
- 6401 SW Mcewan Rd
- 18840 SW 65th Ave
- 18840 65th Ave
- 6397 Mcewan Rd
- 6241 Wayzata Ct
- 6385 Mcewan Rd
- 6262 Wayzata Ct
- 18830 65th Ave
- 6480 Mcewan Rd
- 6420 Mcewan Rd
- 18820 SW 65th Ave
- 18820 65th Ave
- 6310 Mcewan Rd
- 6447 SW Mcewan Rd