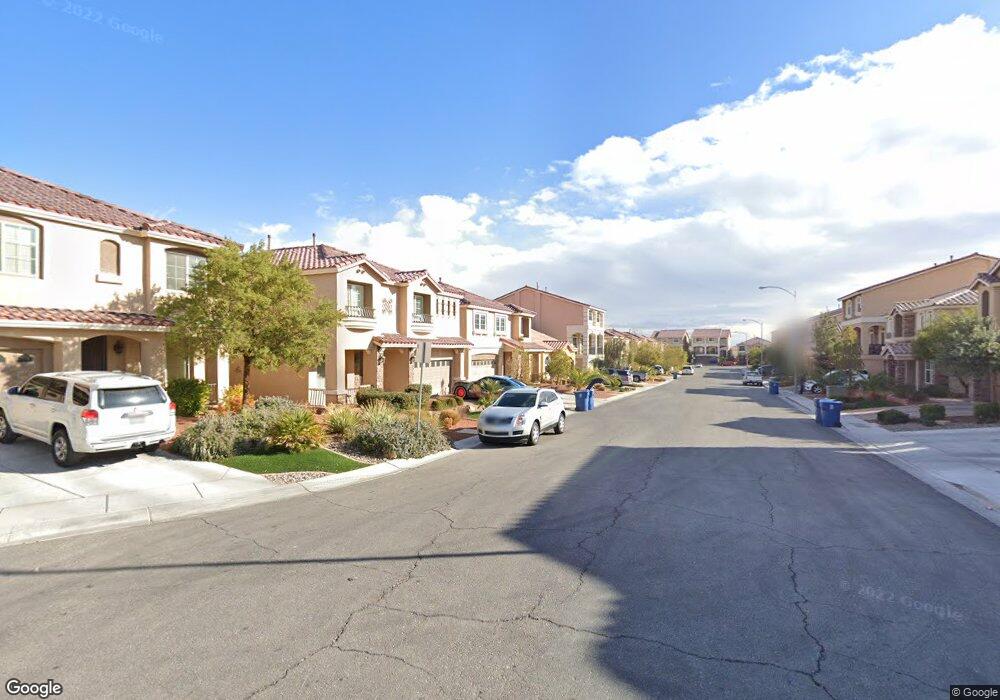
6362 Sharp Rock Ct Las Vegas, NV 89139
Coronado Ranch NeighborhoodEstimated Value: $548,006 - $642,000
3
Beds
3
Baths
2,518
Sq Ft
$233/Sq Ft
Est. Value
About This Home
This home is located at 6362 Sharp Rock Ct, Las Vegas, NV 89139 and is currently estimated at $585,752, approximately $232 per square foot. 6362 Sharp Rock Ct is a home with nearby schools including Mark L Fine Elementary School, Lawrence & Heidi Canarelli Middle School, and Sierra Vista High School.
Ownership History
Date
Name
Owned For
Owner Type
Purchase Details
Closed on
Feb 18, 2015
Sold by
Barlaan Maria
Bought by
Sharp Rock Trust
Current Estimated Value
Purchase Details
Closed on
Oct 27, 2014
Sold by
Obrero Eugenio P
Bought by
Barlaan Maria
Home Financials for this Owner
Home Financials are based on the most recent Mortgage that was taken out on this home.
Original Mortgage
$294,210
Outstanding Balance
$226,382
Interest Rate
4.2%
Mortgage Type
New Conventional
Estimated Equity
$359,370
Purchase Details
Closed on
Oct 7, 2014
Sold by
Reserve 3 Llc
Bought by
Barlaan Maria
Home Financials for this Owner
Home Financials are based on the most recent Mortgage that was taken out on this home.
Original Mortgage
$294,210
Outstanding Balance
$226,382
Interest Rate
4.2%
Mortgage Type
New Conventional
Estimated Equity
$359,370
Purchase Details
Closed on
Oct 14, 2013
Sold by
Canfam Holdings Llc
Bought by
Reserve 3 Llc
Create a Home Valuation Report for This Property
The Home Valuation Report is an in-depth analysis detailing your home's value as well as a comparison with similar homes in the area
Home Values in the Area
Average Home Value in this Area
Purchase History
| Date | Buyer | Sale Price | Title Company |
|---|---|---|---|
| Sharp Rock Trust | -- | None Available | |
| Barlaan Maria | -- | First American Title Centra | |
| Barlaan Maria | $326,900 | First American Title Centra | |
| Reserve 3 Llc | -- | Accommodation |
Source: Public Records
Mortgage History
| Date | Status | Borrower | Loan Amount |
|---|---|---|---|
| Open | Barlaan Maria | $294,210 |
Source: Public Records
Tax History Compared to Growth
Tax History
| Year | Tax Paid | Tax Assessment Tax Assessment Total Assessment is a certain percentage of the fair market value that is determined by local assessors to be the total taxable value of land and additions on the property. | Land | Improvement |
|---|---|---|---|---|
| 2025 | $3,457 | $179,743 | $47,250 | $132,493 |
| 2024 | $3,357 | $179,743 | $47,250 | $132,493 |
| 2023 | $3,357 | $171,330 | $47,250 | $124,080 |
| 2022 | $3,259 | $147,637 | $35,000 | $112,637 |
| 2021 | $3,165 | $129,334 | $33,250 | $96,084 |
| 2020 | $3,069 | $130,214 | $33,250 | $96,964 |
| 2019 | $2,980 | $122,225 | $28,350 | $93,875 |
| 2018 | $2,893 | $111,169 | $25,200 | $85,969 |
| 2017 | $3,223 | $109,893 | $24,150 | $85,743 |
| 2016 | $2,740 | $105,110 | $22,050 | $83,060 |
| 2015 | $2,734 | $99,587 | $19,950 | $79,637 |
| 2014 | $2,653 | $10,500 | $10,500 | $0 |
Source: Public Records
Map
Nearby Homes
- 6314 Sharp Rock Ct
- 6313 Stag Hollow Ct
- 8312 Langhorne Creek St
- 6279 Sierra Knolls Ct
- 8494 Langhorne Creek St
- 6250 Sierra Knolls Ct
- 6275 Mount Palomar Ave
- 8543 Alpine Vineyards Ct
- 6197 Glimmering Light Ave
- 6454 Mount Palomar Ave
- 6465 Grande River Ct
- 8276 Sorrel St
- 6403 Brandon Hills Ct
- 6433 Brandon Hills Ct
- 6125 Cambiata Ct
- 6507 Creekside Cellars Ct
- 8231 Annual Ridge St
- 6609 Samba Ave
- 8624 Calla Lily Ct
- 8151 Misty Sage St
- 6354 Sharp Rock Ct
- 6378 Sharp Rock Ct
- 6346 Sharp Rock Ct
- 6365 Cascade Cliffs Ct
- 6373 Cascade Cliffs Ct
- 6357 Cascade Cliffs Ct
- 5325 Diesel Rd
- 5297 Diesel Rd
- 6381 Cascade Cliffs Ct
- 6386 Sharp Rock Ct
- 6338 Sharp Rock Ct
- 6349 Cascade Cliffs Ct
- 6363 Sharp Rock Ct
- 6355 Sharp Rock Ct
- 6371 Sharp Rock Ct
- 6389 Cascade Cliffs Ct
- 6347 Sharp Rock Ct
- 6341 Cascade Cliffs Ct
- 6379 Sharp Rock Ct
- 6332 Sharp Rock Ct