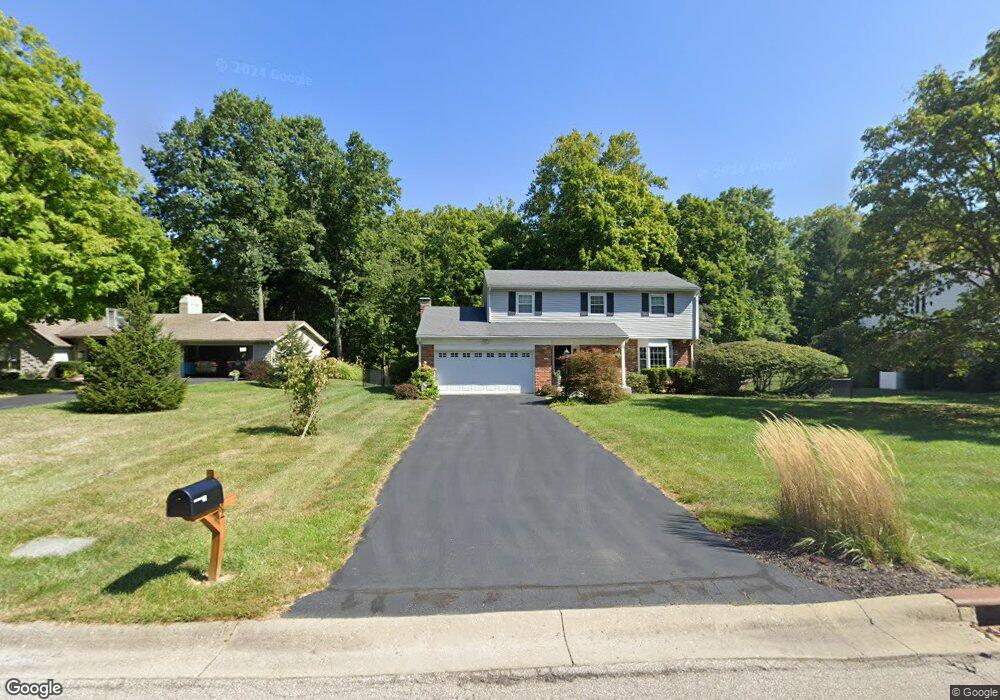
6362 Stirrup Rd Cincinnati, OH 45244
Turpin Hills NeighborhoodEstimated Value: $476,000 - $548,000
4
Beds
3
Baths
2,651
Sq Ft
$189/Sq Ft
Est. Value
About This Home
This home is located at 6362 Stirrup Rd, Cincinnati, OH 45244 and is currently estimated at $501,321, approximately $189 per square foot. 6362 Stirrup Rd is a home located in Hamilton County with nearby schools including Mercer Elementary School, Nagel Middle School, and Turpin High School.
Ownership History
Date
Name
Owned For
Owner Type
Purchase Details
Closed on
Oct 11, 2011
Sold by
Pfingstag Mark and Pfingstag Lori
Bought by
Delany Brian George and Delany Maggie Richardson
Current Estimated Value
Home Financials for this Owner
Home Financials are based on the most recent Mortgage that was taken out on this home.
Original Mortgage
$160,000
Outstanding Balance
$109,231
Interest Rate
4.12%
Mortgage Type
Unknown
Estimated Equity
$392,090
Purchase Details
Closed on
Oct 17, 2006
Sold by
Kepler Philip Paul and Kepler Ann Lusk
Bought by
Pfingstag Mark and Pfingstag Lori
Home Financials for this Owner
Home Financials are based on the most recent Mortgage that was taken out on this home.
Original Mortgage
$237,500
Interest Rate
6.5%
Mortgage Type
Unknown
Purchase Details
Closed on
Aug 2, 2001
Sold by
Atkins Virginia Lee
Bought by
Kepler Philip Paul and Kepler Ann Lusk
Create a Home Valuation Report for This Property
The Home Valuation Report is an in-depth analysis detailing your home's value as well as a comparison with similar homes in the area
Home Values in the Area
Average Home Value in this Area
Purchase History
| Date | Buyer | Sale Price | Title Company |
|---|---|---|---|
| Delany Brian George | $200,000 | Prominent Title Agency Llc | |
| Pfingstag Mark | -- | Classic Title Agency Llc | |
| Kepler Philip Paul | $215,000 | -- |
Source: Public Records
Mortgage History
| Date | Status | Borrower | Loan Amount |
|---|---|---|---|
| Open | Delany Brian George | $160,000 | |
| Previous Owner | Pfingstag Mark | $237,500 |
Source: Public Records
Tax History Compared to Growth
Tax History
| Year | Tax Paid | Tax Assessment Tax Assessment Total Assessment is a certain percentage of the fair market value that is determined by local assessors to be the total taxable value of land and additions on the property. | Land | Improvement |
|---|---|---|---|---|
| 2024 | $7,561 | $124,580 | $27,045 | $97,535 |
| 2023 | $7,192 | $124,580 | $27,045 | $97,535 |
| 2022 | $6,383 | $98,452 | $23,569 | $74,883 |
| 2021 | $6,231 | $98,452 | $23,569 | $74,883 |
| 2020 | $6,303 | $98,452 | $23,569 | $74,883 |
| 2019 | $6,144 | $87,126 | $20,857 | $66,269 |
| 2018 | $5,755 | $87,126 | $20,857 | $66,269 |
| 2017 | $5,427 | $87,126 | $20,857 | $66,269 |
| 2016 | $4,464 | $70,000 | $19,796 | $50,204 |
| 2015 | $4,336 | $70,000 | $19,796 | $50,204 |
| 2014 | $4,339 | $70,000 | $19,796 | $50,204 |
| 2013 | $4,103 | $70,000 | $19,796 | $50,204 |
Source: Public Records
Map
Nearby Homes
- 2669 Newtown Rd
- 2560 Coveyrun Ct
- 6531 Silverfox Dr
- 6625 Triesta Ct
- 6426 Silverfox Dr
- 2454 Doeview Ct
- 2474 Walnutview Ct
- 2213 Clough Ridge Dr Unit 2213
- 6436 Wildhaven Way
- 2453 Sanctuary Cir
- 2447 Coveyrun S
- 6912 Edith St
- 6809 Jefferson St
- 7154 Goldengate Dr
- 7050 Olentangy Ln
- 3320 River Hills Dr
- 5459 Hanover Cir
- 2091 Wadsbury Dr
- 6189 Wasigo Dr
- 2201 Candlemaker Dr
- 6336 Stirrup Rd
- 6380 Stirrup Rd
- 6320 Stirrup Rd
- 6394 Stirrup Rd
- 6400 Stirrup Rd
- 6363 Stirrup Rd
- 6381 Stirrup Rd
- 6345 Stirrup Rd
- 6399 Stirrup Rd
- 6327 Stirrup Rd
- 2709 Bentley Ct
- 2763 Bentley Ct
- 6309 Stirrup Rd
- 6428 Stirrup Rd
- 6417 Stirrup Rd
- 2766 Caledon Ln
- 2778 Caledon Ln
- 2778 Caledon Ln
- 6291 Stirrup Rd
- 6276 Stirrup Rd