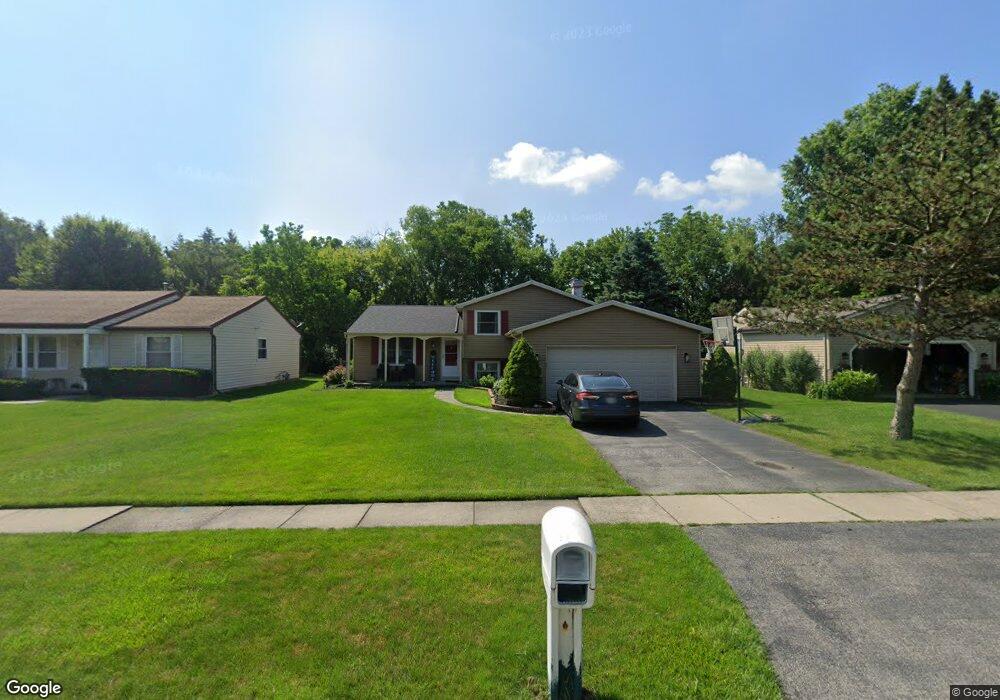
6363 Millbrook Rd Maumee, OH 43537
Estimated Value: $220,626 - $247,000
3
Beds
2
Baths
1,512
Sq Ft
$155/Sq Ft
Est. Value
About This Home
This home is located at 6363 Millbrook Rd, Maumee, OH 43537 and is currently estimated at $234,907, approximately $155 per square foot. 6363 Millbrook Rd is a home located in Lucas County with nearby schools including Holloway Elementary School, Springfield Middle School, and Springfield High School.
Ownership History
Date
Name
Owned For
Owner Type
Purchase Details
Closed on
Nov 14, 2024
Sold by
Redford Curt A and Redford Stephanie
Bought by
Redford Stephanie
Current Estimated Value
Home Financials for this Owner
Home Financials are based on the most recent Mortgage that was taken out on this home.
Original Mortgage
$174,750
Outstanding Balance
$173,113
Interest Rate
6.44%
Mortgage Type
New Conventional
Estimated Equity
$61,794
Purchase Details
Closed on
Mar 19, 2004
Sold by
Zweizig Matthew G and Zweizig Amanda J
Bought by
Redford Curt A
Home Financials for this Owner
Home Financials are based on the most recent Mortgage that was taken out on this home.
Original Mortgage
$138,700
Interest Rate
5.37%
Mortgage Type
Purchase Money Mortgage
Purchase Details
Closed on
Aug 5, 2002
Sold by
Romano Nicholas G and Romano Amy L
Bought by
Zweizig Matthew G and Zweizig Amanda
Home Financials for this Owner
Home Financials are based on the most recent Mortgage that was taken out on this home.
Original Mortgage
$120,600
Interest Rate
6.62%
Purchase Details
Closed on
Jun 2, 1989
Sold by
Lacava Cassandra R
Create a Home Valuation Report for This Property
The Home Valuation Report is an in-depth analysis detailing your home's value as well as a comparison with similar homes in the area
Home Values in the Area
Average Home Value in this Area
Purchase History
| Date | Buyer | Sale Price | Title Company |
|---|---|---|---|
| Redford Stephanie | -- | None Listed On Document | |
| Redford Stephanie | -- | None Listed On Document | |
| Redford Curt A | $146,000 | -- | |
| Zweizig Matthew G | $134,000 | -- | |
| -- | $88,500 | -- |
Source: Public Records
Mortgage History
| Date | Status | Borrower | Loan Amount |
|---|---|---|---|
| Open | Redford Stephanie | $174,750 | |
| Closed | Redford Stephanie | $174,750 | |
| Previous Owner | Redford Curt A | $138,700 | |
| Previous Owner | Zweizig Matthew G | $120,600 |
Source: Public Records
Tax History Compared to Growth
Tax History
| Year | Tax Paid | Tax Assessment Tax Assessment Total Assessment is a certain percentage of the fair market value that is determined by local assessors to be the total taxable value of land and additions on the property. | Land | Improvement |
|---|---|---|---|---|
| 2024 | $1,544 | $50,680 | $12,740 | $37,940 |
| 2023 | $3,414 | $49,175 | $10,955 | $38,220 |
| 2022 | $3,411 | $49,175 | $10,955 | $38,220 |
| 2021 | $3,207 | $49,175 | $10,955 | $38,220 |
| 2020 | $3,047 | $42,350 | $9,135 | $33,215 |
| 2019 | $2,976 | $42,350 | $9,135 | $33,215 |
| 2018 | $2,887 | $42,350 | $9,135 | $33,215 |
| 2017 | $2,821 | $37,450 | $9,380 | $28,070 |
| 2016 | $2,847 | $107,000 | $26,800 | $80,200 |
| 2015 | $2,842 | $107,000 | $26,800 | $80,200 |
| 2014 | $2,528 | $36,020 | $9,030 | $26,990 |
| 2013 | $2,528 | $36,020 | $9,030 | $26,990 |
Source: Public Records
Map
Nearby Homes
- 6325 Millbrook Rd
- 6524 Glenhurst Dr
- 2001 Perrysburg Holland Rd Unit 118
- 6620 Pilliod Rd
- 6652 Sue Ln
- 6705 Garden Rd Unit 6705
- 2437 Knights Hill Ln
- 6666 Inglewood Rd
- 2258 Tanglewood Dr
- 6833 Greentree Ln
- 6627 Embassy Ct Unit I38
- 5844 Swan Creek Dr
- 6917 Greentree Ln
- 6696 Embassy Ct Unit C11
- 6716 Embassy Ct Unit 8
- 6505 Airport Hwy
- 1705 Henthorne Dr
- 5741 Heatherbank Rd
- 6053 Suffolk Ln Unit 6053
- 6949 Nightingale Dr
- 6357 Millbrook Rd
- 6369 Millbrook Rd
- 6351 Millbrook Rd
- 6403 Millbrook Rd
- 6343 Millbrook Rd
- 6368 Millbrook Rd
- 6360 Millbrook Rd
- 6400 Millbrook Rd
- 6408 Millbrook Rd
- 2253 Denton Ln
- 6337 Millbrook Rd
- 6415 Scarsdale Rd
- 6414 Millbrook Rd
- 6421 Scarsdale Rd
- 6429 Scarsdale Rd
- 2245 Denton Ln
- 6331 Millbrook Rd
- 6433 Scarsdale Rd
- 6422 Millbrook Rd
- 2237 Denton Ln