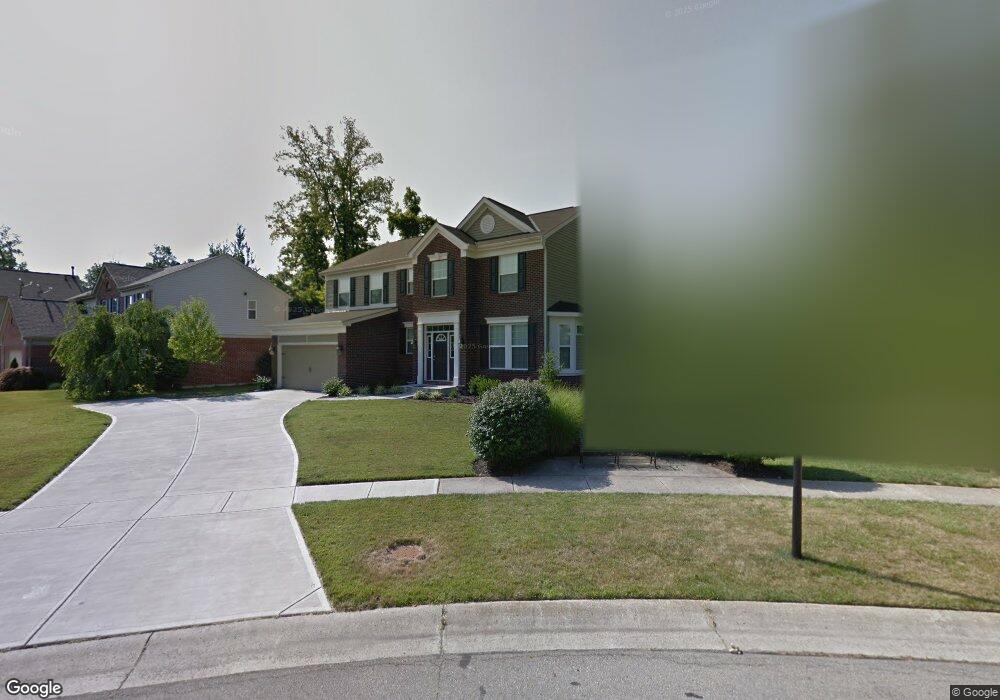
6363 Pickering Grove Unit 580 Morrow, OH 45152
Hamilton Township NeighborhoodEstimated Value: $406,000 - $423,000
4
Beds
3
Baths
2,084
Sq Ft
$200/Sq Ft
Est. Value
About This Home
This home is located at 6363 Pickering Grove Unit 580, Morrow, OH 45152 and is currently estimated at $416,047, approximately $199 per square foot. 6363 Pickering Grove Unit 580 is a home located in Warren County with nearby schools including Little Miami High School.
Ownership History
Date
Name
Owned For
Owner Type
Purchase Details
Closed on
Apr 27, 2016
Sold by
Cogar Allen J and Cogar Sherry L
Bought by
Martinez Ever
Current Estimated Value
Home Financials for this Owner
Home Financials are based on the most recent Mortgage that was taken out on this home.
Original Mortgage
$176,800
Outstanding Balance
$140,377
Interest Rate
3.58%
Mortgage Type
New Conventional
Estimated Equity
$275,670
Purchase Details
Closed on
Nov 10, 2009
Sold by
Fischer Single Family Homes Ii Llc
Bought by
Cogar Allen J and Cogar Sherry L
Home Financials for this Owner
Home Financials are based on the most recent Mortgage that was taken out on this home.
Original Mortgage
$160,000
Interest Rate
5.11%
Mortgage Type
New Conventional
Purchase Details
Closed on
May 29, 2009
Sold by
Grand Communities Ltd
Bought by
Fischer Single Family Homes Ii Llc
Create a Home Valuation Report for This Property
The Home Valuation Report is an in-depth analysis detailing your home's value as well as a comparison with similar homes in the area
Home Values in the Area
Average Home Value in this Area
Purchase History
| Date | Buyer | Sale Price | Title Company |
|---|---|---|---|
| Martinez Ever | -- | American Homeland Title | |
| Cogar Allen J | $200,000 | Lawyers Title | |
| Fischer Single Family Homes Ii Llc | $18,000 | Homestead Title |
Source: Public Records
Mortgage History
| Date | Status | Borrower | Loan Amount |
|---|---|---|---|
| Open | Martinez Ever | $176,800 | |
| Previous Owner | Cogar Allen J | $160,000 |
Source: Public Records
Tax History Compared to Growth
Tax History
| Year | Tax Paid | Tax Assessment Tax Assessment Total Assessment is a certain percentage of the fair market value that is determined by local assessors to be the total taxable value of land and additions on the property. | Land | Improvement |
|---|---|---|---|---|
| 2024 | $5,038 | $112,530 | $29,400 | $83,130 |
| 2023 | $4,456 | $88,749 | $15,067 | $73,682 |
| 2022 | $4,410 | $88,750 | $15,068 | $73,682 |
| 2021 | $4,205 | $88,750 | $15,068 | $73,682 |
| 2020 | $4,005 | $72,153 | $12,250 | $59,903 |
| 2019 | $4,070 | $72,153 | $12,250 | $59,903 |
| 2018 | $3,930 | $72,153 | $12,250 | $59,903 |
| 2017 | $3,406 | $61,824 | $10,672 | $51,153 |
| 2016 | $3,584 | $61,824 | $10,672 | $51,153 |
| 2015 | $1,790 | $61,824 | $10,672 | $51,153 |
| 2014 | $3,660 | $56,200 | $9,700 | $46,500 |
| 2013 | $3,569 | $70,960 | $12,250 | $58,710 |
Source: Public Records
Map
Nearby Homes
- 6250 Avebury Ct
- 6610 Waverly Park
- 6556 Thistle Grove
- 6203 Silver Wood Dr
- 6608 Brampton Abbey
- 6527 Abingdon Hall
- 3 Heath Ct
- 792 Oak Forest Dr
- 668 Thornton Dr
- Camden Plan at Providence - Designer Collection
- Morgan Plan at Providence - Designer Collection
- Wilmington Plan at Providence - Designer Collection
- Amelia Plan at Providence - Designer Collection
- Maxwell Plan at Providence - Designer Collection
- Edenton Plan at Providence - Designer Collection
- 1870 Ford Rd
- 6308 Winding Way
- 1497 Wexler Ct
- 1242 Carrington Place
- 5708 Cochran Rd
- 6363 Pickering Grove
- 6375 Pickering Grove
- 1160 Essex Glen
- 1154 Essex Glen
- 1170 Essex Glenn
- 6393 Pickering Grove
- 1170 Essex Glen
- 1154 Essex Glenn
- 6258 Wedgwood Dr
- 6275 Avebury Ct
- 6485 Hastings Ct
- 6253 Wedgwood Dr
- 6451 Pickering Grove
- 6246 Wedgwood Dr
- 1155 Essex Glen
- 6308 Binley Woods
- 6271 Avebury Ct
- 6473 Hastings Ct
- 1161 Essex Glenn
- 1161 Essex Glen