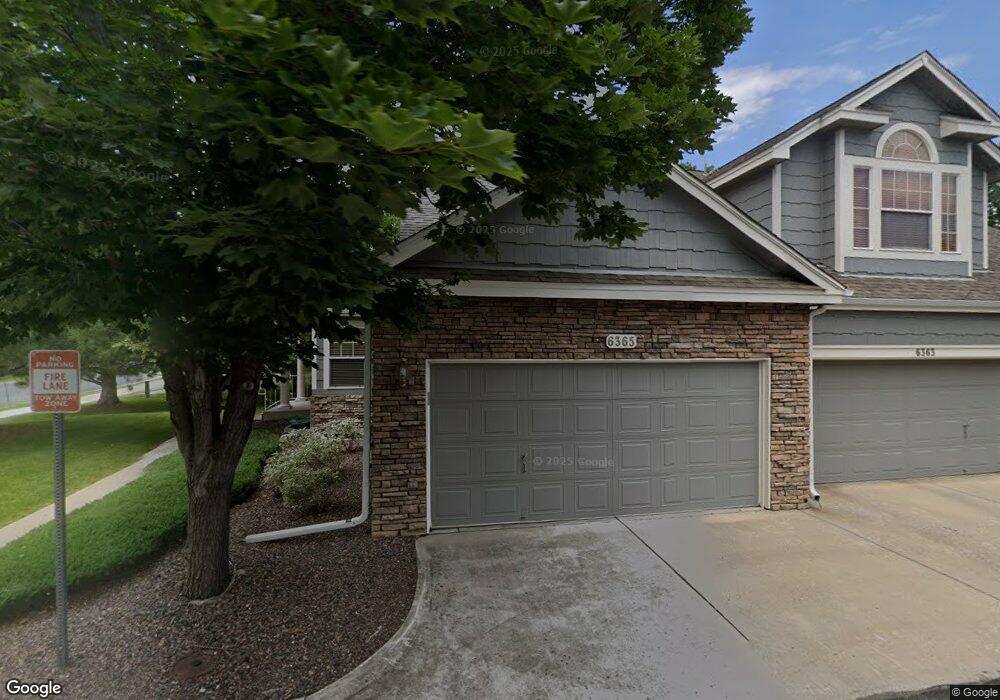
6365 Deframe Way Arvada, CO 80004
Ralston Valley NeighborhoodEstimated Value: $506,000 - $589,000
3
Beds
3
Baths
1,177
Sq Ft
$469/Sq Ft
Est. Value
About This Home
This home is located at 6365 Deframe Way, Arvada, CO 80004 and is currently estimated at $552,246, approximately $469 per square foot. 6365 Deframe Way is a home located in Jefferson County with nearby schools including Magnolia Avenue Elementary School, Fremont Elementary School, and Drake Junior High School.
Ownership History
Date
Name
Owned For
Owner Type
Purchase Details
Closed on
Nov 28, 2006
Sold by
Stokes Steven and Crowe Sara E
Bought by
Falcione Albert A and Falcione Marilyn A
Current Estimated Value
Home Financials for this Owner
Home Financials are based on the most recent Mortgage that was taken out on this home.
Original Mortgage
$212,000
Outstanding Balance
$127,451
Interest Rate
6.41%
Mortgage Type
Purchase Money Mortgage
Estimated Equity
$424,795
Purchase Details
Closed on
Dec 13, 2005
Sold by
Stokes Carolyn L
Bought by
Stokes Steven and Crowe Sara E
Purchase Details
Closed on
Dec 18, 2002
Sold by
Miller Georgia M and Seaman Raymond Kirkland
Bought by
Stokes Carolyn L
Purchase Details
Closed on
Aug 9, 2001
Sold by
Seaman Linda Ann
Bought by
Seaman Annagale R and Seaman Raymond Kirkland
Purchase Details
Closed on
Feb 10, 1999
Sold by
Village Homes Of Colorado Inc
Bought by
Seaman Annagale R and Seaman Linda Ann
Create a Home Valuation Report for This Property
The Home Valuation Report is an in-depth analysis detailing your home's value as well as a comparison with similar homes in the area
Home Values in the Area
Average Home Value in this Area
Purchase History
| Date | Buyer | Sale Price | Title Company |
|---|---|---|---|
| Falcione Albert A | $265,000 | Fahtco | |
| Stokes Steven | -- | -- | |
| Stokes Carolyn L | $226,500 | Land Title Guarantee Company | |
| Seaman Annagale R | -- | -- | |
| Seaman Annagale R | $182,621 | Land Title |
Source: Public Records
Mortgage History
| Date | Status | Borrower | Loan Amount |
|---|---|---|---|
| Open | Falcione Albert A | $212,000 |
Source: Public Records
Tax History Compared to Growth
Tax History
| Year | Tax Paid | Tax Assessment Tax Assessment Total Assessment is a certain percentage of the fair market value that is determined by local assessors to be the total taxable value of land and additions on the property. | Land | Improvement |
|---|---|---|---|---|
| 2024 | $2,042 | $27,752 | $7,555 | $20,197 |
| 2023 | $2,042 | $27,752 | $7,555 | $20,197 |
| 2022 | $1,596 | $23,244 | $3,643 | $19,601 |
| 2021 | $1,622 | $23,913 | $3,748 | $20,165 |
| 2020 | $1,708 | $24,851 | $6,349 | $18,502 |
| 2019 | $1,685 | $24,851 | $6,349 | $18,502 |
| 2018 | $1,398 | $21,476 | $3,890 | $17,586 |
| 2017 | $1,280 | $21,476 | $3,890 | $17,586 |
| 2016 | $2,009 | $21,117 | $4,974 | $16,143 |
| 2015 | $2,046 | $21,117 | $4,974 | $16,143 |
| 2014 | $2,046 | $20,211 | $4,012 | $16,199 |
Source: Public Records
Map
Nearby Homes
- 6312 Deframe Way
- 6254 Devinney Cir
- 6332 Coors Ln
- 13812 W 64th Place
- 13618 W 62nd Dr
- 6060 Deframe Ct
- 13651 W 65th Ave
- 6537 Coors St
- 13245 W 63rd Cir
- 13275 W 63rd Place
- 13432 W 65th Place
- 13553 W 65th Place
- 6414 Zinnia St
- 13155 W 63rd Place
- 6416 Zang Ct
- 13168 W 62nd Dr
- 12912 W 61st Cir
- 12321 W 58th Dr
- 15014 W 63rd Ave
- 12924 W 64th Dr Unit B
- 6363 Deframe Way
- 6357 Deframe Way
- 6359 Deframe Way
- 6361 Deframe Way
- 6355 Deframe Way
- 6353 Deframe Way
- 6351 Deframe Way
- 6347 Deframe Way
- 6205 Devinney Cir
- 6367 Deframe Way
- 6341 Deframe Way
- 6339 Deframe Way
- 6369 Deframe Way
- 6289 Devinney Cir
- 6366 Deframe Way
- 6287 Devinney Cir
- 6207 Devinney Cir
- 6352 Deframe Way
- 6371 Deframe Way
- 6343 Deframe Way