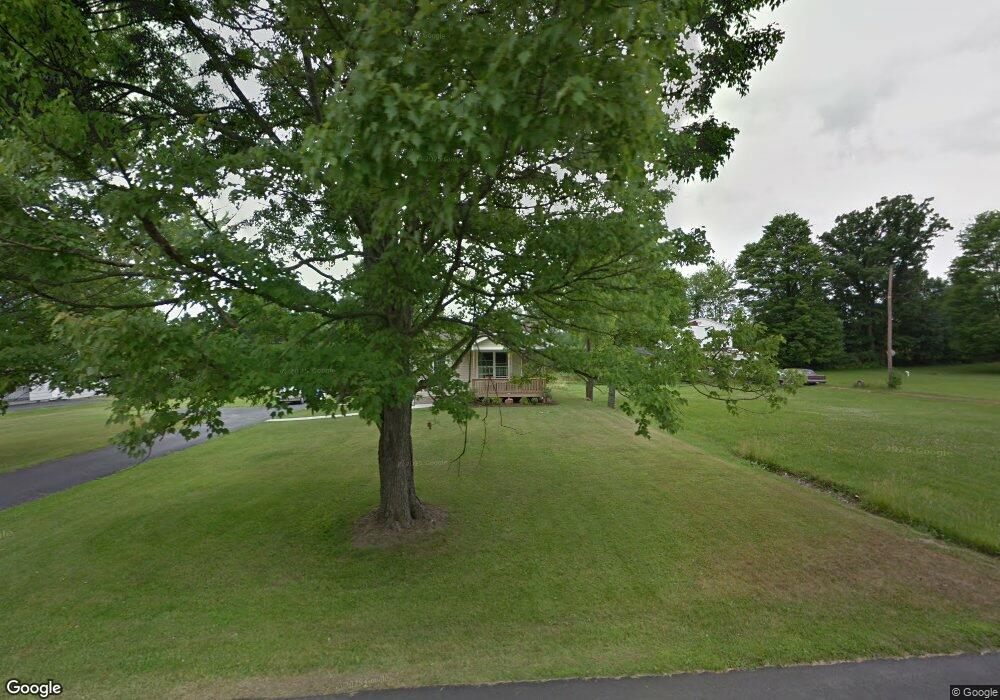
6366 Morningside Dr Hubbard, OH 44425
Estimated Value: $94,000 - $194,000
3
Beds
1
Bath
912
Sq Ft
$150/Sq Ft
Est. Value
About This Home
This home is located at 6366 Morningside Dr, Hubbard, OH 44425 and is currently estimated at $137,247, approximately $150 per square foot. 6366 Morningside Dr is a home located in Trumbull County with nearby schools including Hubbard Elementary School, Hubbard Middle School, and Hubbard High School.
Ownership History
Date
Name
Owned For
Owner Type
Purchase Details
Closed on
Oct 7, 2010
Sold by
Grzelak Joseph W and Grzelak Joyce D
Bought by
Williams Laura J
Current Estimated Value
Home Financials for this Owner
Home Financials are based on the most recent Mortgage that was taken out on this home.
Original Mortgage
$65,766
Outstanding Balance
$43,421
Interest Rate
4.36%
Mortgage Type
New Conventional
Estimated Equity
$93,826
Purchase Details
Closed on
Dec 8, 2008
Sold by
The Bank Of New York
Bought by
Grzelak Joseph W and Grzelak Joyce D
Purchase Details
Closed on
Jun 10, 2008
Sold by
Cook Edward L
Bought by
Bank Of New York
Purchase Details
Closed on
Jun 28, 1996
Sold by
Reed Jeffrey D
Bought by
Cook Edward A
Home Financials for this Owner
Home Financials are based on the most recent Mortgage that was taken out on this home.
Original Mortgage
$38,343
Interest Rate
8.13%
Mortgage Type
FHA
Purchase Details
Closed on
Jan 1, 1990
Bought by
Jeffrey D Reed
Create a Home Valuation Report for This Property
The Home Valuation Report is an in-depth analysis detailing your home's value as well as a comparison with similar homes in the area
Home Values in the Area
Average Home Value in this Area
Purchase History
| Date | Buyer | Sale Price | Title Company |
|---|---|---|---|
| Williams Laura J | $63,500 | Attorney | |
| Grzelak Joseph W | $12,500 | Service Link | |
| Bank Of New York | $28,000 | None Available | |
| Cook Edward A | $38,000 | -- | |
| Jeffrey D Reed | -- | -- |
Source: Public Records
Mortgage History
| Date | Status | Borrower | Loan Amount |
|---|---|---|---|
| Open | Williams Laura J | $65,766 | |
| Previous Owner | Cook Edward A | $38,343 |
Source: Public Records
Tax History Compared to Growth
Tax History
| Year | Tax Paid | Tax Assessment Tax Assessment Total Assessment is a certain percentage of the fair market value that is determined by local assessors to be the total taxable value of land and additions on the property. | Land | Improvement |
|---|---|---|---|---|
| 2024 | $1,160 | $19,990 | $1,370 | $18,620 |
| 2023 | $1,160 | $19,990 | $1,370 | $18,620 |
| 2022 | $1,015 | $15,580 | $1,370 | $14,210 |
| 2021 | $1,019 | $15,580 | $1,370 | $14,210 |
| 2020 | $1,023 | $15,580 | $1,370 | $14,210 |
| 2019 | $991 | $14,290 | $1,370 | $12,920 |
| 2018 | $962 | $14,290 | $1,370 | $12,920 |
| 2017 | $960 | $14,290 | $1,370 | $12,920 |
| 2016 | $1,037 | $16,170 | $1,190 | $14,980 |
| 2015 | $1,040 | $16,170 | $1,190 | $14,980 |
| 2014 | $1,021 | $16,170 | $1,190 | $14,980 |
| 2013 | $1,070 | $16,980 | $1,190 | $15,790 |
Source: Public Records
Map
Nearby Homes
- 366 Westview Ave
- 269 Westview Ave
- 229 Jacobs Rd
- 279 Parish Ave
- 3317 Beechwood Dr
- 663 Meadowland Dr
- 665 Wendemere Dr
- 254 Christian Ave
- 531 Meadowland Dr
- 5843 Fairlawn Ave
- V/L Jacobs Rd
- 126 Stewart St
- 110 School St
- 248 Myron St
- 50 Walnut St
- 2051 Blair Ave
- 319 E Liberty St
- 2954 Megan Cir
- 2951 Megan Cir
- 114 Oakdale Ave
- 6358 Morningside Dr
- 6378 Morningside Dr
- 6361 Morningside Dr
- 6350 Morningside Dr
- 6373 Morningside Dr
- 350 Jacobs Rd
- 6353 Morningside Dr
- 6379 Morningside Dr
- 332 Jacobs Rd
- 6351 Morningside Dr
- 6330 Morningside Dr
- 6345 Morningside Dr
- 314 Jacobs Rd
- 6337 Morningside Dr
- 0 Jacobs Rd Unit 3749272
- 6325 Morningside Dr
- 357 Jacobs Rd
- 349 Jacobs Rd
- 367 Jacobs Rd
- 6314 Morningside Dr