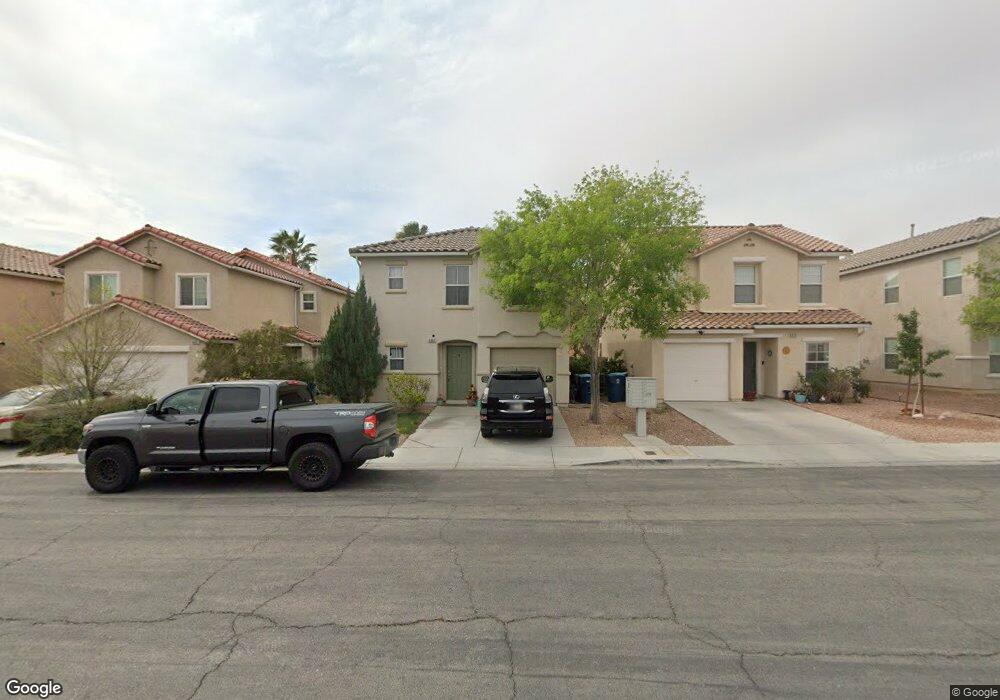
6367 Cactus Dahlia St Unit 2A Las Vegas, NV 89141
Highlands Ranch NeighborhoodEstimated Value: $386,457 - $393,000
3
Beds
3
Baths
1,486
Sq Ft
$262/Sq Ft
Est. Value
About This Home
This home is located at 6367 Cactus Dahlia St Unit 2A, Las Vegas, NV 89141 and is currently estimated at $388,864, approximately $261 per square foot. 6367 Cactus Dahlia St Unit 2A is a home located in Clark County with nearby schools including Aldeane Comito Ries Elementary School, Lois & Jerry Tarkanian Middle School, and Desert Oasis High School.
Ownership History
Date
Name
Owned For
Owner Type
Purchase Details
Closed on
Mar 16, 2022
Sold by
Mees and Christopher
Bought by
Mees Alicia and Mees Christopher
Current Estimated Value
Home Financials for this Owner
Home Financials are based on the most recent Mortgage that was taken out on this home.
Original Mortgage
$287,000
Outstanding Balance
$267,446
Interest Rate
3.69%
Mortgage Type
New Conventional
Estimated Equity
$121,418
Purchase Details
Closed on
Jun 3, 2003
Sold by
Kb Home Nevada Inc
Bought by
Christiansen Alicia and Mees Christopher
Home Financials for this Owner
Home Financials are based on the most recent Mortgage that was taken out on this home.
Original Mortgage
$151,387
Interest Rate
5.71%
Mortgage Type
FHA
Create a Home Valuation Report for This Property
The Home Valuation Report is an in-depth analysis detailing your home's value as well as a comparison with similar homes in the area
Home Values in the Area
Average Home Value in this Area
Purchase History
| Date | Buyer | Sale Price | Title Company |
|---|---|---|---|
| Mees Alicia | -- | Boston National Title Agency | |
| Christiansen Alicia | $153,781 | First American Title Company |
Source: Public Records
Mortgage History
| Date | Status | Borrower | Loan Amount |
|---|---|---|---|
| Open | Mees Alicia | $287,000 | |
| Previous Owner | Christiansen Alicia | $151,387 | |
| Closed | Christiansen Alicia | $8,600 |
Source: Public Records
Tax History Compared to Growth
Tax History
| Year | Tax Paid | Tax Assessment Tax Assessment Total Assessment is a certain percentage of the fair market value that is determined by local assessors to be the total taxable value of land and additions on the property. | Land | Improvement |
|---|---|---|---|---|
| 2025 | $1,273 | $95,364 | $36,750 | $58,614 |
| 2024 | $1,206 | $95,364 | $36,750 | $58,614 |
| 2023 | $1,206 | $86,752 | $31,500 | $55,252 |
| 2022 | $983 | $78,480 | $28,000 | $50,480 |
| 2021 | $1,137 | $72,492 | $24,500 | $47,992 |
| 2020 | $1,100 | $71,030 | $23,450 | $47,580 |
| 2019 | $1,068 | $66,369 | $19,600 | $46,769 |
| 2018 | $1,037 | $61,212 | $16,450 | $44,762 |
| 2017 | $1,749 | $59,630 | $14,350 | $45,280 |
| 2016 | $983 | $49,807 | $11,900 | $37,907 |
| 2015 | $981 | $43,426 | $8,750 | $34,676 |
| 2014 | $952 | $31,485 | $5,250 | $26,235 |
Source: Public Records
Map
Nearby Homes
- 6377 W Haleh Ave
- 10221 Burning Bush St
- 6249 Desert Lavender Ave
- 6190 Sierra Blue Ct
- 6346 Rock Stream Ln
- 6335 Rock Stream Ln
- 10241 Sweet Woodruff Dr
- 10077 Cooper Mountain St
- Barnet Plan at Wesley Park
- Sheffield Plan at Wesley Park
- Trafford Plan at Wesley Park
- Halton Plan at Wesley Park
- Halton Peak Plan at Wesley Park
- 6337 W Cactus Ave
- 10519 Mann St
- 5989 Rockway Glen Ave
- 10529 Longoria Garden St
- 5946 Ancient Peaks Ave
- 10550 El Camino Rd
- 5927 W Frias Ave
- 6373 Cactus Dahlia St Unit 2A
- 6361 Cactus Dahlia St
- 6379 Cactus Dahlia St
- 6379 Cactus Dahlia St
- 6355 Cactus Dahlia St
- 6366 Whispering Clouds Ct Unit 2A
- 6372 Whispering Clouds Ct Unit 2A
- 6360 Whispering Clouds Ct
- 6385 Cactus Dahlia St Unit 2A
- 6349 Cactus Dahlia St
- 6378 Whispering Clouds Ct
- 6354 Whispering Clouds Ct
- 6391 Cactus Dahlia St
- 6343 Cactus Dahlia St
- 6384 Whispering Clouds Ct
- 6348 Whispering Clouds Ct
- 6374 Cactus Dahlia St
- 6380 Cactus Dahlia St
- 6342 Whispering Clouds Ct
- 6350 Cactus Dahlia St