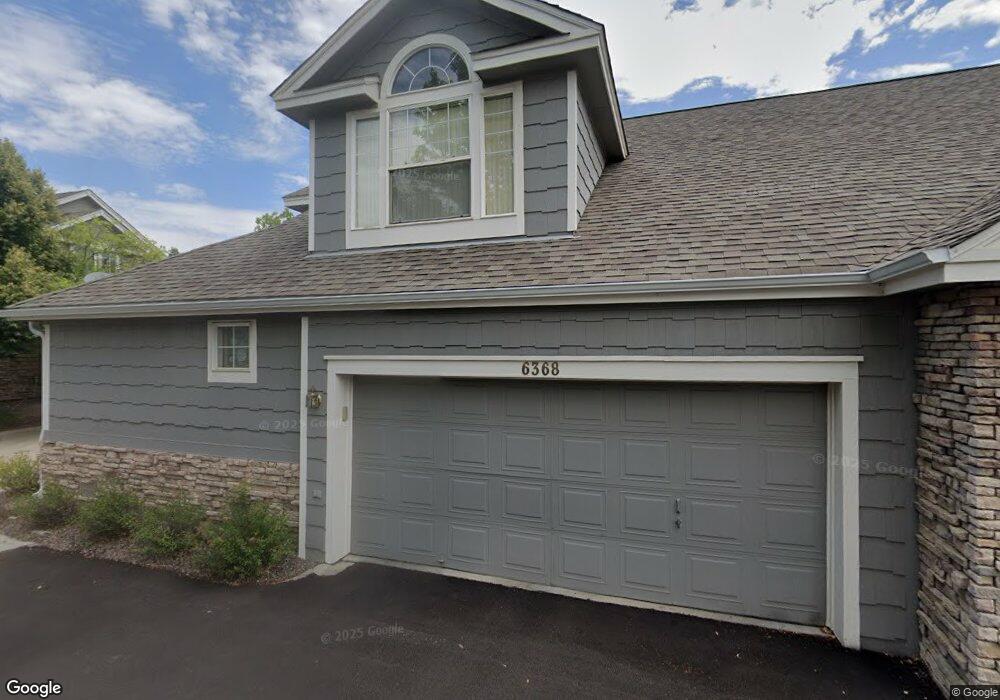
6368 Deframe Way Arvada, CO 80004
Ralston Valley NeighborhoodEstimated Value: $571,930 - $647,000
2
Beds
3
Baths
2,277
Sq Ft
$263/Sq Ft
Est. Value
About This Home
This home is located at 6368 Deframe Way, Arvada, CO 80004 and is currently estimated at $599,233, approximately $263 per square foot. 6368 Deframe Way is a home located in Jefferson County with nearby schools including Fremont Elementary School, Drake Junior High School, and Arvada West High School.
Ownership History
Date
Name
Owned For
Owner Type
Purchase Details
Closed on
Jul 20, 2015
Sold by
Vanstelten Drew and Van Stelten Sharon
Bought by
Van Stelten Trust
Current Estimated Value
Purchase Details
Closed on
Mar 15, 2013
Sold by
Weston Eugene L and Margaret Weston A
Bought by
Vanstelten Drew and Van Stelten Sharon
Purchase Details
Closed on
Aug 25, 2010
Sold by
Blanckaert Gary A and Blanckaert Connie
Bought by
Weston M D Eugene L and Margaret Weston A
Purchase Details
Closed on
Aug 17, 2009
Sold by
L W Elias Living Trust
Bought by
Blanckaert Gary A and Blanckaert Connie
Purchase Details
Closed on
Oct 1, 2007
Sold by
Elias L W
Bought by
L W Elias Living Trust
Purchase Details
Closed on
Jul 16, 2007
Sold by
Jean M Elias Family Trust
Bought by
Elias L W
Purchase Details
Closed on
Apr 28, 2003
Sold by
Elias L W
Bought by
Jean M Elias Family Trust
Purchase Details
Closed on
Nov 27, 1998
Sold by
Village Homes Of Colorado Inc
Bought by
Elias Jean M
Create a Home Valuation Report for This Property
The Home Valuation Report is an in-depth analysis detailing your home's value as well as a comparison with similar homes in the area
Home Values in the Area
Average Home Value in this Area
Purchase History
| Date | Buyer | Sale Price | Title Company |
|---|---|---|---|
| Van Stelten Trust | -- | None Available | |
| Vanstelten Drew | $279,500 | Heritage Title | |
| Weston M D Eugene L | $268,500 | Chicago Title Co | |
| Blanckaert Gary A | $265,000 | Htco | |
| L W Elias Living Trust | -- | None Available | |
| Elias L W | -- | None Available | |
| Jean M Elias Family Trust | -- | -- | |
| Elias Jean M | $195,000 | Land Title |
Source: Public Records
Tax History
| Year | Tax Paid | Tax Assessment Tax Assessment Total Assessment is a certain percentage of the fair market value that is determined by local assessors to be the total taxable value of land and additions on the property. | Land | Improvement |
|---|---|---|---|---|
| 2024 | $2,741 | $28,258 | $7,351 | $20,907 |
| 2023 | $2,741 | $28,258 | $7,351 | $20,907 |
| 2022 | $2,447 | $24,989 | $3,544 | $21,445 |
| 2021 | $2,488 | $25,709 | $3,646 | $22,063 |
| 2020 | $2,513 | $26,037 | $6,178 | $19,859 |
| 2019 | $2,479 | $26,037 | $6,178 | $19,859 |
| 2018 | $2,232 | $22,799 | $3,784 | $19,015 |
| 2017 | $2,044 | $22,799 | $3,784 | $19,015 |
| 2016 | $2,158 | $22,677 | $4,974 | $17,703 |
| 2015 | $2,228 | $22,677 | $4,974 | $17,703 |
| 2014 | $2,228 | $22,010 | $4,012 | $17,998 |
Source: Public Records
Map
Nearby Homes
- 6304 Deframe Way
- 13509 W 62nd Dr
- 6369 Cole Ln
- 13812 W 64th Place
- 13571 W 61st Ln
- 13750 W 65th Ave
- 6262 Braun Cir
- 13275 W 63rd Place
- 13352 W 65th Place
- 13155 W 63rd Place
- 13334 W 65th Dr
- 13294 W 65th Dr
- 6069 Zinnia St
- 6065 Zang Way
- 12995 W 63rd Place Unit A
- 6725 Beech Ct
- 6053 Youngfield St
- 5276 Flora Way
- 5316 Flora Way
- 14050 W 68th Ave
- 6366 Deframe Way
- 6370 Deframe Way
- 6369 Deframe Way
- 6372 Deframe Way
- 6367 Deframe Way
- 6371 Deframe Way
- 6344 Deframe Way
- 6350 Deframe Way
- 6373 Deframe Way
- 6352 Deframe Way
- 6342 Deframe Way
- 6376 Deframe Way
- 6375 Deframe Way
- 6351 Deframe Way
- 6355 Deframe Way
- 6378 Deframe Way
- 6377 Deframe Way
- 6353 Deframe Way
- 6346 Deframe Way
- 6357 Deframe Way
Your Personal Tour Guide
Ask me questions while you tour the home.