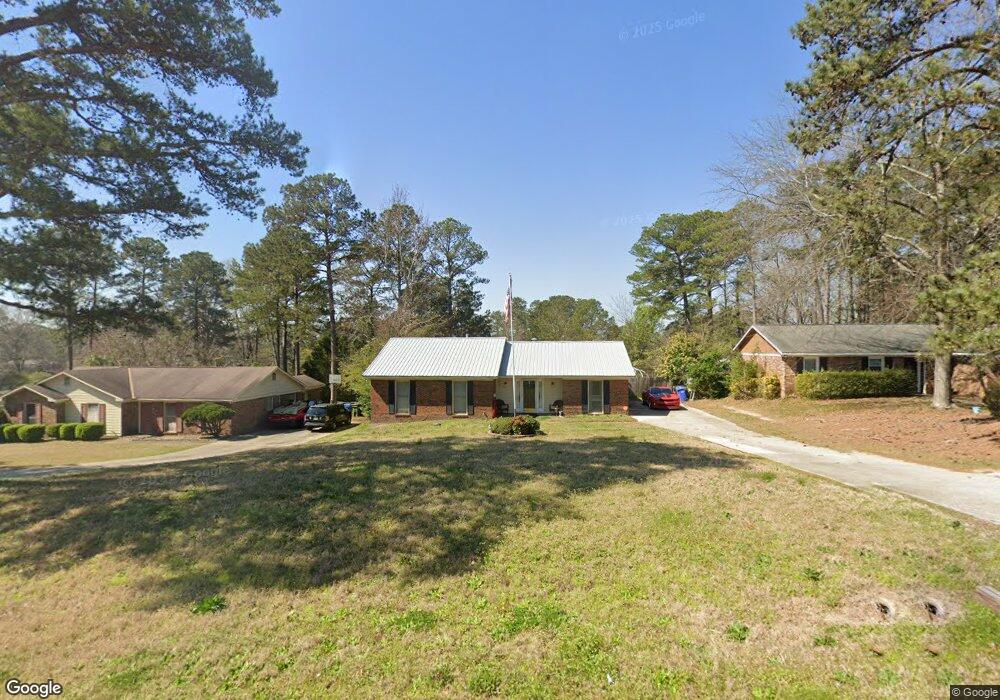
6369 Billings Rd Columbus, GA 31909
Midland NeighborhoodEstimated Value: $223,000 - $231,000
3
Beds
3
Baths
1,605
Sq Ft
$141/Sq Ft
Est. Value
About This Home
This home is located at 6369 Billings Rd, Columbus, GA 31909 and is currently estimated at $226,568, approximately $141 per square foot. 6369 Billings Rd is a home located in Muscogee County with nearby schools including Midland Academy, Midland Middle School, and Shaw High School.
Ownership History
Date
Name
Owned For
Owner Type
Purchase Details
Closed on
Apr 19, 2021
Sold by
Worth Amanda L
Bought by
Worth Amanda L and Simmons Alexander L
Current Estimated Value
Home Financials for this Owner
Home Financials are based on the most recent Mortgage that was taken out on this home.
Original Mortgage
$105,000
Outstanding Balance
$94,802
Interest Rate
3%
Mortgage Type
New Conventional
Estimated Equity
$131,766
Purchase Details
Closed on
Aug 6, 2018
Sold by
Worth Carl G
Bought by
Worth Amanda G
Purchase Details
Closed on
Sep 28, 2010
Sold by
Price Drucye C
Bought by
Worth Carl G
Home Financials for this Owner
Home Financials are based on the most recent Mortgage that was taken out on this home.
Original Mortgage
$133,206
Interest Rate
4.25%
Mortgage Type
FHA
Create a Home Valuation Report for This Property
The Home Valuation Report is an in-depth analysis detailing your home's value as well as a comparison with similar homes in the area
Home Values in the Area
Average Home Value in this Area
Purchase History
| Date | Buyer | Sale Price | Title Company |
|---|---|---|---|
| Worth Amanda L | -- | -- | |
| Worth Amanda G | -- | -- | |
| Worth Carl G | $135,000 | None Available |
Source: Public Records
Mortgage History
| Date | Status | Borrower | Loan Amount |
|---|---|---|---|
| Open | Worth Amanda L | $105,000 | |
| Previous Owner | Worth Carl G | $133,206 |
Source: Public Records
Tax History Compared to Growth
Tax History
| Year | Tax Paid | Tax Assessment Tax Assessment Total Assessment is a certain percentage of the fair market value that is determined by local assessors to be the total taxable value of land and additions on the property. | Land | Improvement |
|---|---|---|---|---|
| 2025 | $1,938 | $77,524 | $10,076 | $67,448 |
| 2024 | $1,937 | $77,524 | $10,076 | $67,448 |
| 2023 | $1,255 | $77,524 | $10,076 | $67,448 |
| 2022 | $2,019 | $56,056 | $10,076 | $45,980 |
| 2021 | $2,013 | $50,188 | $10,076 | $40,112 |
| 2020 | $2,013 | $50,188 | $10,076 | $40,112 |
| 2019 | $2,021 | $50,188 | $10,076 | $40,112 |
| 2018 | $2,021 | $50,188 | $10,076 | $40,112 |
| 2017 | $2,030 | $50,188 | $10,076 | $40,112 |
| 2016 | $2,038 | $62,684 | $5,003 | $57,681 |
| 2015 | $2,041 | $62,684 | $5,003 | $57,681 |
| 2014 | $2,044 | $62,684 | $5,003 | $57,681 |
| 2013 | -- | $62,684 | $5,003 | $57,681 |
Source: Public Records
Map
Nearby Homes
- 6454 Georgian Way
- 6222 Goodwin Dr
- 6251 Rockefeller Dr
- 6528 Yellow Stone Ct
- 6 Jamestown Ct
- 7020 Stoneridge Cir
- 6333 Stony Creek Dr
- 6454 Patriot Dr
- 6263 Potomac Cir
- 7076 Stoneybrook Dr
- 5378 Misty Ln
- 6036 Townes Way
- 6055 Townes Way
- 6127 Stony Creek Dr
- 5422 Colony Dr
- 5324 Colony Dr
- 5045 Old Post Rd
- 5408 Old Dominion Rd
- 5966 Fornof Rd
- 5042 Foxfire Dr
- 6381 Billings Rd
- 6357 Billings Rd
- 6345 Billings Rd
- 5682 Jamestown Dr
- 6393 Billings Rd
- 5694 Jamestown Dr
- 6333 Billings Rd
- 6405 Billings Rd
- 6375 Independence Dr
- 6367 Independence Dr
- 5706 Jamestown Dr
- 6383 Independence Dr
- 5664 Jamestown Dr
- 6334 Goodwin Dr
- 6321 Billings Rd
- 5913 Billings Ct
- 6359 Independence Dr
- 5925 Billings Ct
- 5901 Billings Ct
- 6354 Abbey Dr