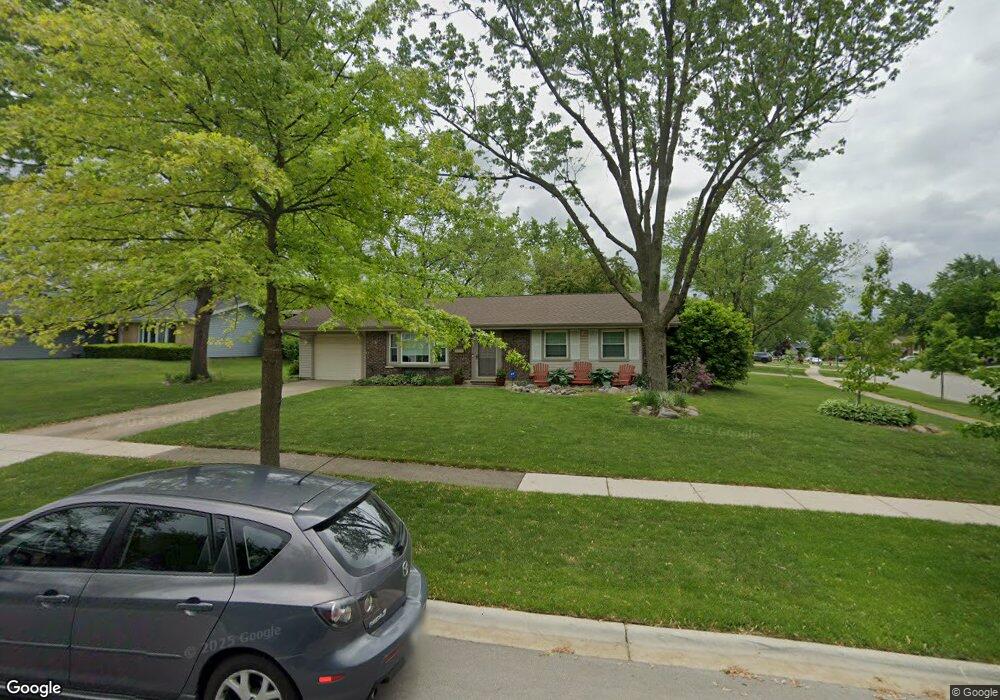
637 Balboa Ct Schaumburg, IL 60193
South Schaumburg NeighborhoodEstimated Value: $359,000 - $391,000
3
Beds
2
Baths
1,140
Sq Ft
$330/Sq Ft
Est. Value
About This Home
This home is located at 637 Balboa Ct, Schaumburg, IL 60193 and is currently estimated at $376,317, approximately $330 per square foot. 637 Balboa Ct is a home located in Cook County with nearby schools including Edwin Aldrin Elementary School, Robert Frost Junior High School, and Schaumburg High School.
Ownership History
Date
Name
Owned For
Owner Type
Purchase Details
Closed on
Mar 31, 2012
Sold by
Schantz Eleanor
Bought by
Marselle David and Marselle Karalyn
Current Estimated Value
Home Financials for this Owner
Home Financials are based on the most recent Mortgage that was taken out on this home.
Original Mortgage
$147,283
Interest Rate
3.75%
Mortgage Type
FHA
Purchase Details
Closed on
Apr 30, 2001
Sold by
Johnson Ronald E and Johnson Norvette M
Bought by
Schantz Robert C and Schantz Eleanor
Purchase Details
Closed on
Nov 15, 1994
Sold by
Johannes Timothy G and Johannes Jeannie L
Bought by
Johnson Ronald E and Johnson Norvette M
Home Financials for this Owner
Home Financials are based on the most recent Mortgage that was taken out on this home.
Original Mortgage
$100,000
Interest Rate
9.06%
Create a Home Valuation Report for This Property
The Home Valuation Report is an in-depth analysis detailing your home's value as well as a comparison with similar homes in the area
Home Values in the Area
Average Home Value in this Area
Purchase History
| Date | Buyer | Sale Price | Title Company |
|---|---|---|---|
| Marselle David | $150,000 | First American Title | |
| Schantz Robert C | $195,000 | -- | |
| Johnson Ronald E | $125,000 | -- |
Source: Public Records
Mortgage History
| Date | Status | Borrower | Loan Amount |
|---|---|---|---|
| Previous Owner | Marselle David | $147,283 | |
| Previous Owner | Johnson Ronald E | $100,000 |
Source: Public Records
Tax History Compared to Growth
Tax History
| Year | Tax Paid | Tax Assessment Tax Assessment Total Assessment is a certain percentage of the fair market value that is determined by local assessors to be the total taxable value of land and additions on the property. | Land | Improvement |
|---|---|---|---|---|
| 2024 | $5,571 | $22,007 | $6,252 | $15,755 |
| 2023 | $5,862 | $23,204 | $6,252 | $16,952 |
| 2022 | $5,862 | $25,000 | $6,252 | $18,748 |
| 2021 | $4,776 | $19,087 | $4,242 | $14,845 |
| 2020 | $4,761 | $19,087 | $4,242 | $14,845 |
| 2019 | $5,252 | $23,024 | $4,242 | $18,782 |
| 2018 | $4,241 | $17,567 | $3,796 | $13,771 |
| 2017 | $4,192 | $17,567 | $3,796 | $13,771 |
| 2016 | $4,667 | $19,391 | $3,796 | $15,595 |
| 2015 | $3,703 | $15,000 | $3,349 | $11,651 |
| 2014 | $3,678 | $15,000 | $3,349 | $11,651 |
| 2013 | $4,325 | $15,000 | $3,349 | $11,651 |
Source: Public Records
Map
Nearby Homes
- 516 W Weathersfield Way
- 412 Redwood Ln
- 712 Dante Ct
- 305 Williams Dr
- 220 Kemah Ln
- 818 Brentwood Ct
- 315 Ashwood Dr
- 908 Jeffery Ct
- 1027 Duxbury Ln
- 226 Timbercrest Dr
- 988 Chelsea Ln
- 415 Laconia Ln
- 12 Stone Bridge Ct
- 635 Limerick Ln Unit 2B
- 11 Stone Bridge Ct
- 1008 Shannock Ln
- 631 Derry Ct Unit 3C
- 1109 Beach Comber Dr
- 614 Tralee Ct Unit 2-C
- 32 Hilltop Dr
- 708 Boxwood Dr
- 633 Balboa Ct
- 712 Boxwood Dr
- 706 Boxwood Dr
- 629 Balboa Ct Unit 14
- 626 Janine Ln
- 711 Boxwood Dr
- 709 Boxwood Dr Unit 14
- 634 Balboa Ct
- 627 Janine Ln
- 707 Boxwood Dr
- 704 Boxwood Dr
- 630 Balboa Ct
- 714 Boxwood Dr
- 713 Boxwood Dr
- 627 Balboa Ct
- 527 Grace Ln
- 705 Boxwood Dr
- 531 Grace Ln
- 625 Janine Ln