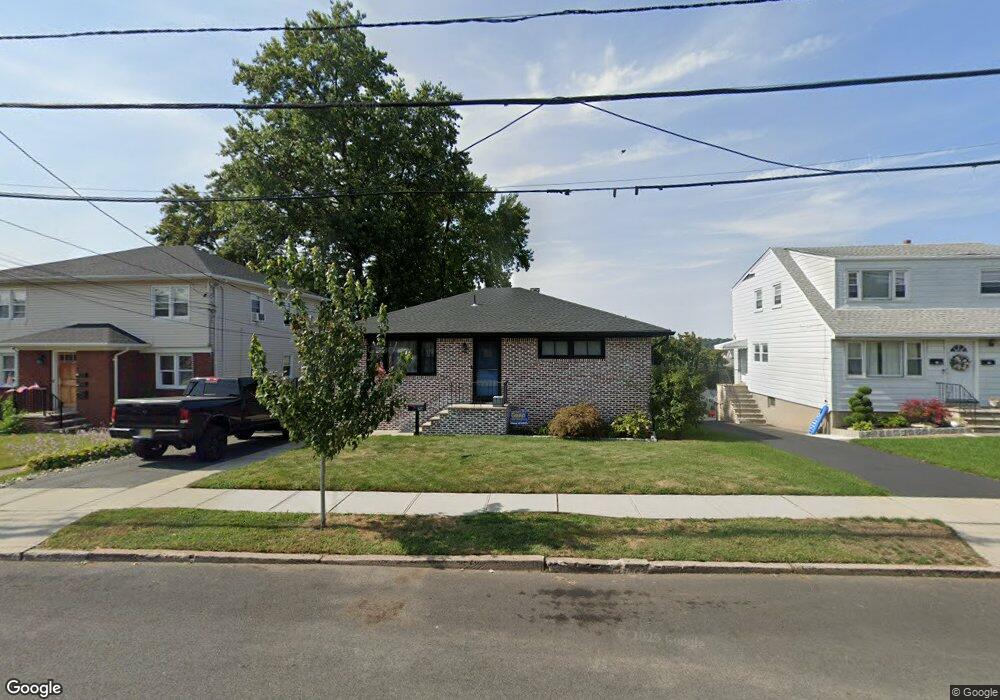
637 Chase Ave Lyndhurst, NJ 07071
Estimated Value: $554,261 - $706,000
--
Bed
--
Bath
1,184
Sq Ft
$524/Sq Ft
Est. Value
About This Home
This home is located at 637 Chase Ave, Lyndhurst, NJ 07071 and is currently estimated at $620,565, approximately $524 per square foot. 637 Chase Ave is a home located in Bergen County with nearby schools including Lyndhurst High School and Sacred Heart School.
Ownership History
Date
Name
Owned For
Owner Type
Purchase Details
Closed on
Feb 27, 2017
Sold by
Montalto Giovanni and Montalto Angela
Bought by
Montalto Frank and Montalto Tracey
Current Estimated Value
Home Financials for this Owner
Home Financials are based on the most recent Mortgage that was taken out on this home.
Original Mortgage
$298,381
Outstanding Balance
$247,982
Interest Rate
4.25%
Mortgage Type
FHA
Estimated Equity
$372,583
Purchase Details
Closed on
Nov 10, 1987
Bought by
Montalto Giovanni and Montalto Angela
Create a Home Valuation Report for This Property
The Home Valuation Report is an in-depth analysis detailing your home's value as well as a comparison with similar homes in the area
Home Values in the Area
Average Home Value in this Area
Purchase History
| Date | Buyer | Sale Price | Title Company |
|---|---|---|---|
| Montalto Frank | $345,000 | Fidelity National Title | |
| Montalto Giovanni | $215,000 | -- |
Source: Public Records
Mortgage History
| Date | Status | Borrower | Loan Amount |
|---|---|---|---|
| Open | Montalto Frank | $298,381 |
Source: Public Records
Tax History Compared to Growth
Tax History
| Year | Tax Paid | Tax Assessment Tax Assessment Total Assessment is a certain percentage of the fair market value that is determined by local assessors to be the total taxable value of land and additions on the property. | Land | Improvement |
|---|---|---|---|---|
| 2025 | $9,391 | $453,900 | $289,800 | $164,100 |
| 2024 | $9,071 | $450,200 | $286,800 | $163,400 |
| 2023 | $9,506 | $446,400 | $283,800 | $162,600 |
| 2022 | $9,506 | $299,700 | $175,000 | $124,700 |
| 2021 | $9,111 | $299,700 | $175,000 | $124,700 |
| 2020 | $8,913 | $299,700 | $175,000 | $124,700 |
| 2019 | $8,847 | $299,700 | $175,000 | $124,700 |
| 2018 | $8,919 | $299,700 | $175,000 | $124,700 |
| 2017 | $8,694 | $299,700 | $175,000 | $124,700 |
| 2016 | $8,499 | $299,700 | $175,000 | $124,700 |
| 2015 | $8,233 | $299,700 | $175,000 | $124,700 |
| 2014 | $8,125 | $299,700 | $175,000 | $124,700 |
Source: Public Records
Map
Nearby Homes