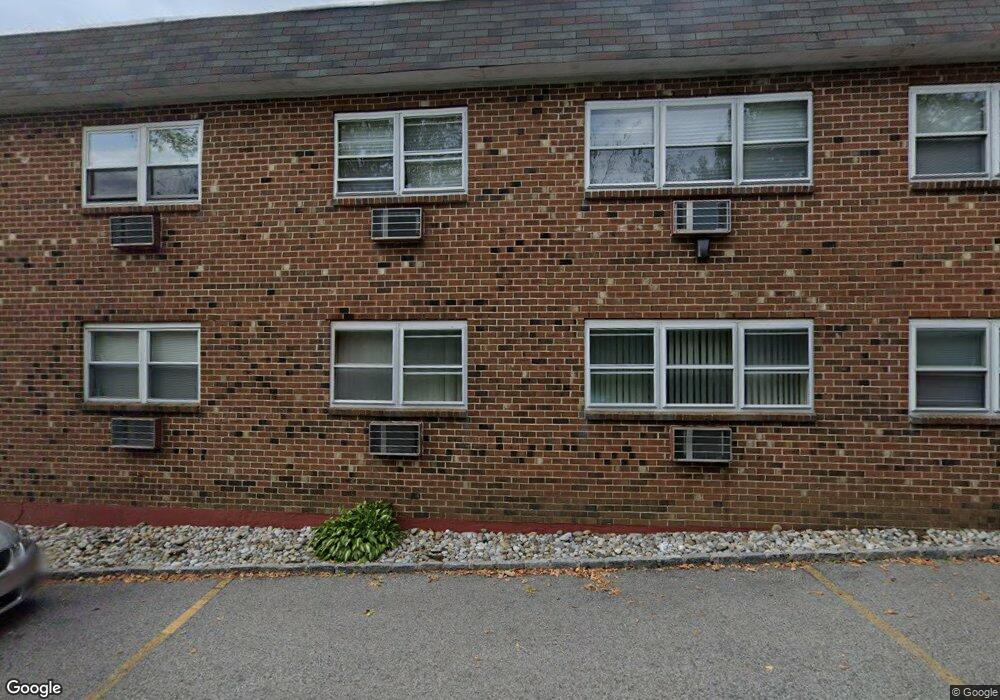
637 Cove Rd Unit D9 Stamford, CT 06902
The Cove NeighborhoodEstimated Value: $217,716 - $288,000
1
Bed
1
Bath
796
Sq Ft
$315/Sq Ft
Est. Value
About This Home
This home is located at 637 Cove Rd Unit D9, Stamford, CT 06902 and is currently estimated at $250,929, approximately $315 per square foot. 637 Cove Rd Unit D9 is a home located in Fairfield County with nearby schools including K. T. Murphy Elementary School, Rippowam Middle School, and Stamford High School.
Ownership History
Date
Name
Owned For
Owner Type
Purchase Details
Closed on
Jun 10, 2021
Sold by
Scott Marina
Bought by
Bocchetta Constance M and Bocchetta Gina L
Current Estimated Value
Purchase Details
Closed on
Apr 1, 2003
Sold by
Lewandowski Robert
Bought by
Scott Marina
Home Financials for this Owner
Home Financials are based on the most recent Mortgage that was taken out on this home.
Original Mortgage
$156,465
Interest Rate
5.91%
Purchase Details
Closed on
Nov 7, 2002
Sold by
Mingyuk-Chao Sylvia
Bought by
Lewandowski Roger
Home Financials for this Owner
Home Financials are based on the most recent Mortgage that was taken out on this home.
Original Mortgage
$109,600
Interest Rate
6.04%
Purchase Details
Closed on
Aug 12, 1987
Sold by
Water Evelyn
Bought by
Yan Ming-Yuk
Home Financials for this Owner
Home Financials are based on the most recent Mortgage that was taken out on this home.
Original Mortgage
$82,600
Interest Rate
10.4%
Create a Home Valuation Report for This Property
The Home Valuation Report is an in-depth analysis detailing your home's value as well as a comparison with similar homes in the area
Home Values in the Area
Average Home Value in this Area
Purchase History
| Date | Buyer | Sale Price | Title Company |
|---|---|---|---|
| Bocchetta Constance M | $180,000 | None Available | |
| Scott Marina | $164,700 | -- | |
| Lewandowski Roger | $137,000 | -- | |
| Yan Ming-Yuk | $118,000 | -- |
Source: Public Records
Mortgage History
| Date | Status | Borrower | Loan Amount |
|---|---|---|---|
| Previous Owner | Yan Ming-Yuk | $64,500 | |
| Previous Owner | Yan Ming-Yuk | $156,465 | |
| Previous Owner | Yan Ming-Yuk | $109,600 | |
| Previous Owner | Yan Ming-Yuk | $82,600 |
Source: Public Records
Tax History Compared to Growth
Tax History
| Year | Tax Paid | Tax Assessment Tax Assessment Total Assessment is a certain percentage of the fair market value that is determined by local assessors to be the total taxable value of land and additions on the property. | Land | Improvement |
|---|---|---|---|---|
| 2025 | $2,793 | $116,770 | $0 | $116,770 |
| 2024 | $2,728 | $116,770 | $0 | $116,770 |
| 2023 | $2,947 | $116,770 | $0 | $116,770 |
| 2022 | $2,984 | $109,830 | $0 | $109,830 |
| 2021 | $2,959 | $109,830 | $0 | $109,830 |
| 2020 | $2,894 | $109,830 | $0 | $109,830 |
| 2019 | $2,894 | $109,830 | $0 | $109,830 |
| 2018 | $2,804 | $109,830 | $0 | $109,830 |
| 2017 | $2,456 | $91,320 | $0 | $91,320 |
| 2016 | $2,385 | $91,320 | $0 | $91,320 |
| 2015 | $2,322 | $91,320 | $0 | $91,320 |
| 2014 | $2,264 | $91,320 | $0 | $91,320 |
Source: Public Records
Map
Nearby Homes
- 697 Cove Rd Unit 1E
- 697 Cove Rd Unit 2A
- 737 Cove Rd Unit D2
- 55 Avery St
- 15 Robin St
- 31 Wascussee Ln Unit 65
- 114 Sylvan Knoll Rd
- 421 Sylvan Knoll Rd
- 209 Seaside Ave Unit 2
- 274 Sylvan Knoll Rd
- 214 Seaside Ave
- 214 Seaside Ave Unit 2
- 21 Saint Benedict Cir
- 33 Dora St
- 16 Neponsit St
- 171 Sylvan Knoll Rd
- 203 Sylvan Knoll Rd
- 28 Aquila Rd
- 120 Webb Ave
- 107 Lockwood Ave Unit 1B
- 637 Cove Rd Unit D20
- 637 Cove Rd Unit D19
- 637 Cove Rd Unit D18
- 637 Cove Rd Unit D17
- 637 Cove Rd Unit D16
- 637 Cove Rd Unit D15
- 637 Cove Rd Unit D13
- 637 Cove Rd Unit D12
- 637 Cove Rd Unit D11
- 637 Cove Rd Unit D10
- 637 Cove Rd Unit D8
- 637 Cove Rd Unit D7
- 637 Cove Rd Unit D6
- 637 Cove Rd Unit D5
- 637 Cove Rd Unit D4
- 637 Cove Rd Unit D3
- 637 Cove Rd Unit D2
- 637 Cove Rd Unit D1
- 637 Cove Rd Unit C20