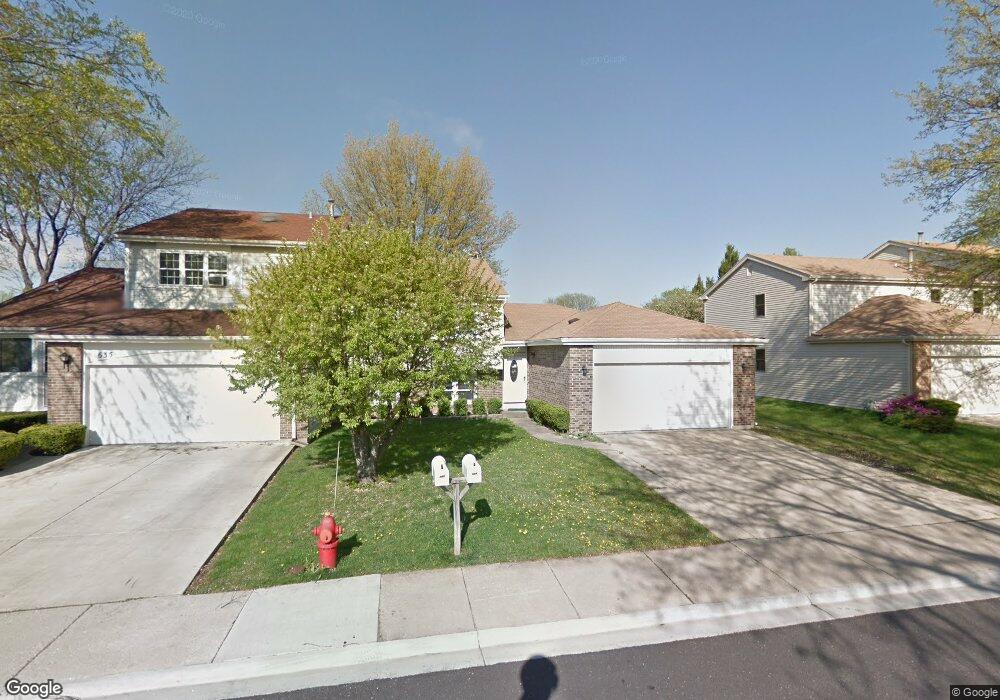
637 Dunsten Cir Northbrook, IL 60062
Estimated Value: $465,000 - $572,000
3
Beds
3
Baths
1,500
Sq Ft
$344/Sq Ft
Est. Value
About This Home
This home is located at 637 Dunsten Cir, Northbrook, IL 60062 and is currently estimated at $515,927, approximately $343 per square foot. 637 Dunsten Cir is a home located in Cook County with nearby schools including Westmoor Elementary School, Northbrook Junior High School, and Glenbrook North High School.
Ownership History
Date
Name
Owned For
Owner Type
Purchase Details
Closed on
Mar 17, 2017
Sold by
Rayyan John and Rayyan Lama
Bought by
Jung Jibsoc and Jung Eunice
Current Estimated Value
Home Financials for this Owner
Home Financials are based on the most recent Mortgage that was taken out on this home.
Original Mortgage
$110,000
Outstanding Balance
$90,428
Interest Rate
4.12%
Mortgage Type
New Conventional
Estimated Equity
$425,499
Purchase Details
Closed on
Mar 14, 2005
Sold by
Zaborko Michael and Zaborko Luba
Bought by
Rayyan John and Rayyan Lama
Home Financials for this Owner
Home Financials are based on the most recent Mortgage that was taken out on this home.
Original Mortgage
$248,500
Interest Rate
5.64%
Mortgage Type
Unknown
Purchase Details
Closed on
Jun 21, 1996
Sold by
Jones Eleanor P and Hausherer Eleanor B
Bought by
Zaborko Michael and Zaborko Luba
Home Financials for this Owner
Home Financials are based on the most recent Mortgage that was taken out on this home.
Original Mortgage
$184,000
Interest Rate
6.37%
Create a Home Valuation Report for This Property
The Home Valuation Report is an in-depth analysis detailing your home's value as well as a comparison with similar homes in the area
Home Values in the Area
Average Home Value in this Area
Purchase History
| Date | Buyer | Sale Price | Title Company |
|---|---|---|---|
| Jung Jibsoc | $360,000 | Attorney Title Guaranty Fund | |
| Rayyan John | $355,000 | Rtc | |
| Zaborko Michael | $230,000 | Intercounty Title |
Source: Public Records
Mortgage History
| Date | Status | Borrower | Loan Amount |
|---|---|---|---|
| Open | Jung Jibsoc | $110,000 | |
| Previous Owner | Rayyan John | $248,500 | |
| Previous Owner | Zaborko Michael | $184,000 |
Source: Public Records
Tax History
| Year | Tax Paid | Tax Assessment Tax Assessment Total Assessment is a certain percentage of the fair market value that is determined by local assessors to be the total taxable value of land and additions on the property. | Land | Improvement |
|---|---|---|---|---|
| 2025 | $9,066 | $42,000 | $8,794 | $33,206 |
| 2024 | $9,066 | $43,000 | $6,500 | $36,500 |
| 2023 | $8,771 | $43,000 | $6,500 | $36,500 |
| 2022 | $8,771 | $43,000 | $6,500 | $36,500 |
| 2021 | $6,502 | $29,357 | $5,221 | $24,136 |
| 2020 | $6,428 | $29,357 | $5,221 | $24,136 |
| 2019 | $6,978 | $32,261 | $5,221 | $27,040 |
| 2018 | $6,594 | $28,158 | $4,534 | $23,624 |
| 2017 | $5,654 | $28,158 | $4,534 | $23,624 |
| 2016 | $5,506 | $28,158 | $4,534 | $23,624 |
| 2015 | $4,980 | $23,642 | $3,847 | $19,795 |
| 2014 | $5,062 | $24,936 | $3,847 | $21,089 |
| 2013 | $4,892 | $24,936 | $3,847 | $21,089 |
Source: Public Records
Map
Nearby Homes
- 640 Pfingsten Rd
- 580 Greenwood Rd
- 2535 Stonebridge Ln
- 818 Bach St
- 3030 Pheasant Creek Dr Unit 405
- 3030 Pheasant Creek Dr Unit 102
- 847 Division St
- 3050 Pheasant Creek Dr Unit 407
- 3070 Pheasant Creek Dr Unit 207
- 2506 Peachtree Ln
- 2700 Crabtree Ln
- 3085 Pheasant Creek Dr Unit 212
- 925 Spring Hill Dr Unit 101
- 3110 Pheasant Creek Dr Unit 101
- 3110 Pheasant Creek Dr Unit 104
- 3110 Pheasant Creek Dr Unit 206
- 3110 Pheasant Creek Dr Unit 318
- 2348 Ash Ln
- 1116 Adirondack Dr
- 1331 Pfingsten Rd
- 635 Dunsten Cir
- 643 Dunsten Cir
- 627 Dunsten Cir
- 645 Dunsten Cir
- 640 Dunsten Cir
- 638 Dunsten Cir
- 621 Dunsten Cir
- 625 Dunsten Cir
- 642 Dunsten Cir
- 636 Dunsten Cir
- 619 Dunsten Cir
- 541 Dunsten Cir
- 644 Dunsten Cir
- 605 Dunsten Cir
- 603 Dunsten Cir
- 634 Dunsten Cir
- 607 Dunsten Cir
- 601 Dunsten Cir
- 617 Dunsten Cir
- 646 Dunsten Cir
Your Personal Tour Guide
Ask me questions while you tour the home.