Estimated Value: $73,768 - $89,000
2
Beds
1
Bath
672
Sq Ft
$123/Sq Ft
Est. Value
About This Home
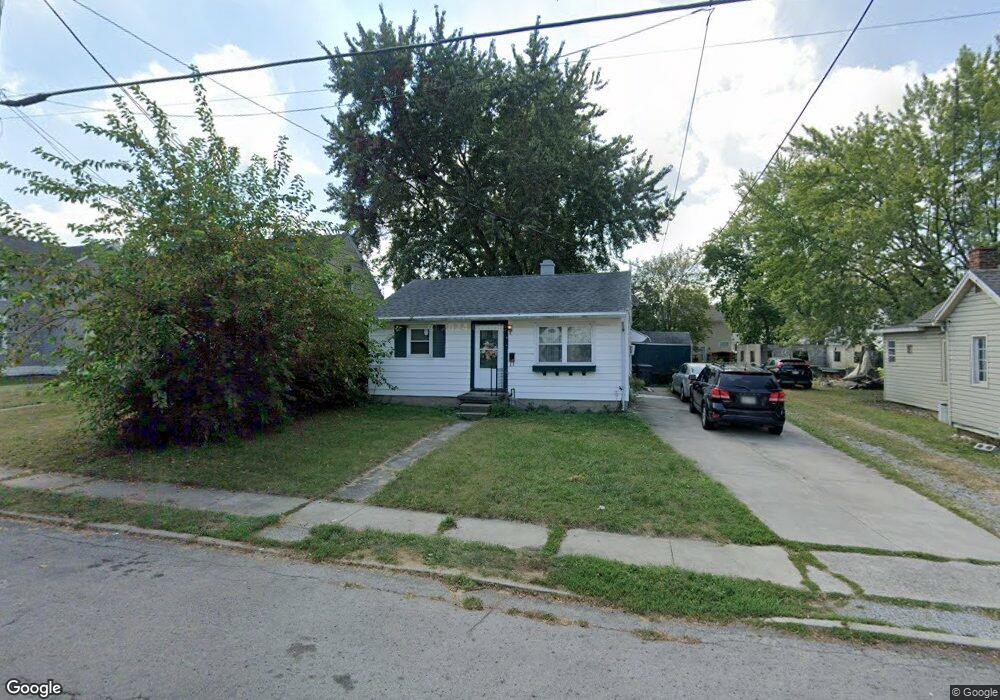
This home is located at 637 Ewing Ave, Lima, OH 45801 and is currently estimated at $82,442, approximately $122 per square foot. 637 Ewing Ave is a home located in Allen County with nearby schools including Independence Elementary School, Lima North Middle School, and Lima West Middle School.
Ownership History
Date
Name
Owned For
Owner Type
Purchase Details
Closed on
Apr 28, 2015
Sold by
Singer Susan
Bought by
Lumpkins Lindsey M
Current Estimated Value
Purchase Details
Closed on
Aug 26, 2008
Sold by
Hooks Sidney I and Hooks Kathleen E
Bought by
Singer Susan
Home Financials for this Owner
Home Financials are based on the most recent Mortgage that was taken out on this home.
Original Mortgage
$48,348
Interest Rate
6.66%
Mortgage Type
FHA
Purchase Details
Closed on
Jun 25, 1998
Sold by
Spradlin Melissa
Bought by
Hughes Robert and Hughes Vicki
Home Financials for this Owner
Home Financials are based on the most recent Mortgage that was taken out on this home.
Original Mortgage
$21,000
Interest Rate
7.5%
Mortgage Type
New Conventional
Purchase Details
Closed on
Mar 11, 1994
Sold by
Thomas Rebecca L
Bought by
Spradlin Melissa
Purchase Details
Closed on
Apr 19, 1991
Bought by
Thomas Rebecca L
Create a Home Valuation Report for This Property
The Home Valuation Report is an in-depth analysis detailing your home's value as well as a comparison with similar homes in the area
Purchase History
| Date | Buyer | Sale Price | Title Company |
|---|---|---|---|
| Lumpkins Lindsey M | -- | None Available | |
| Singer Susan | $48,000 | Attorney | |
| Hughes Robert | $30,000 | -- | |
| Spradlin Melissa | $22,000 | -- | |
| Thomas Rebecca L | -- | -- |
Source: Public Records
Mortgage History
| Date | Status | Borrower | Loan Amount |
|---|---|---|---|
| Previous Owner | Singer Susan | $48,348 | |
| Previous Owner | Hughes Robert | $21,000 |
Source: Public Records
Tax History
| Year | Tax Paid | Tax Assessment Tax Assessment Total Assessment is a certain percentage of the fair market value that is determined by local assessors to be the total taxable value of land and additions on the property. | Land | Improvement |
|---|---|---|---|---|
| 2024 | $598 | $15,580 | $3,610 | $11,970 |
| 2023 | $545 | $12,260 | $2,840 | $9,420 |
| 2022 | $560 | $12,260 | $2,840 | $9,420 |
| 2021 | $592 | $12,260 | $2,840 | $9,420 |
| 2020 | $596 | $10,960 | $2,730 | $8,230 |
| 2019 | $596 | $10,960 | $2,730 | $8,230 |
| 2018 | $594 | $10,960 | $2,730 | $8,230 |
| 2017 | $598 | $10,960 | $2,730 | $8,230 |
| 2016 | $606 | $10,960 | $2,730 | $8,230 |
| 2015 | $735 | $10,960 | $2,730 | $8,230 |
| 2014 | $735 | $13,370 | $2,660 | $10,710 |
| 2013 | $716 | $13,370 | $2,660 | $10,710 |
Source: Public Records
Map
Nearby Homes
- 841 N Baxter St
- 934 N Metcalf St
- 816 N Baxter St
- 777 Ewing Ave
- 635 W Ashton Ave
- 638 Hazel Ave
- 631 Hazel Ave
- 928 Burch Ave
- 435 Marian Ave
- 406 Ewing Ave
- 557 W Ashton Ave
- 576 W Ashton Ave
- 416 Hazel Ave
- 555 Haller St
- 1021 N McDonel St
- 645 W O'Connor Ave
- 316 Ewing Ave
- 1120 Melrose St
- 703 N Collett St
- 760 W O'Connor Ave
Your Personal Tour Guide
Ask me questions while you tour the home.