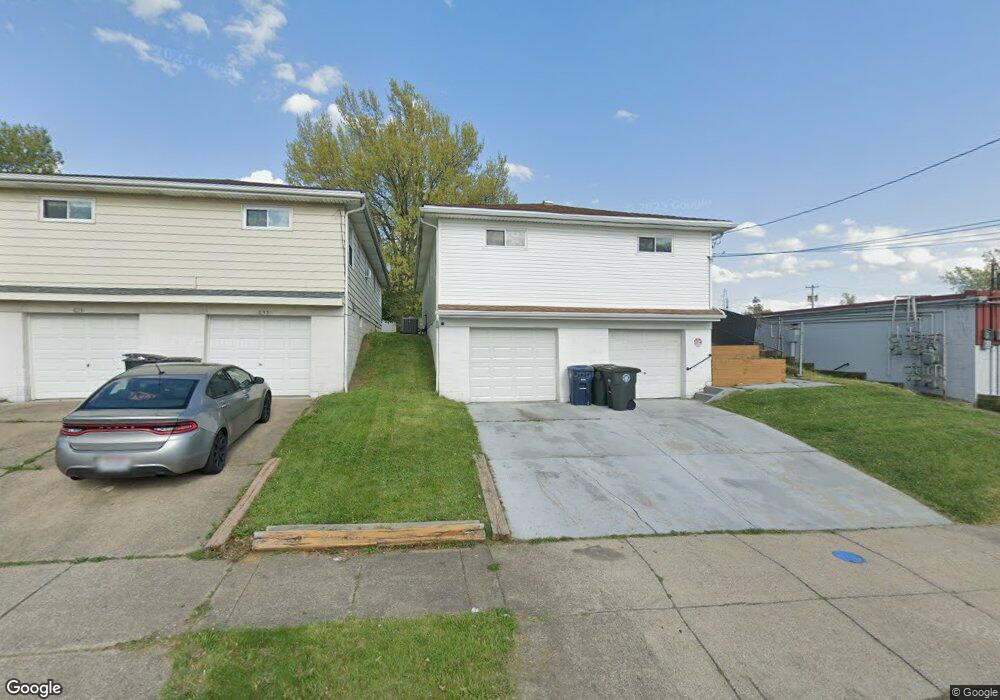
637 Fulmer Ave Unit 639 Akron, OH 44312
Ellet NeighborhoodEstimated Value: $152,000 - $178,385
4
Beds
2
Baths
1,456
Sq Ft
$115/Sq Ft
Est. Value
About This Home
This home is located at 637 Fulmer Ave Unit 639, Akron, OH 44312 and is currently estimated at $167,096, approximately $114 per square foot. 637 Fulmer Ave Unit 639 is a home located in Summit County with nearby schools including Ellet High School, Summit Academy Akron Elementary School, and Eagle Elementary.
Ownership History
Date
Name
Owned For
Owner Type
Purchase Details
Closed on
Jun 27, 2022
Sold by
Mohammad Amawi
Bought by
Dye Monique
Current Estimated Value
Home Financials for this Owner
Home Financials are based on the most recent Mortgage that was taken out on this home.
Original Mortgage
$137,464
Outstanding Balance
$131,016
Interest Rate
5.3%
Mortgage Type
FHA
Estimated Equity
$36,080
Purchase Details
Closed on
May 18, 2017
Sold by
Biondo David A
Bought by
Amawi Mohammad
Home Financials for this Owner
Home Financials are based on the most recent Mortgage that was taken out on this home.
Original Mortgage
$63,325
Interest Rate
4.02%
Mortgage Type
New Conventional
Purchase Details
Closed on
Nov 6, 2009
Sold by
Biondo David
Bought by
Lupica Frances S and Jack A Lupica Living Trust
Purchase Details
Closed on
Nov 3, 2009
Sold by
Lupica Frances and Biondo Joseph
Bought by
Biondo David A
Purchase Details
Closed on
Sep 22, 2009
Sold by
Estate Of Joseph T Lupica
Bought by
Lupica Jack A and Biondo Mary B
Create a Home Valuation Report for This Property
The Home Valuation Report is an in-depth analysis detailing your home's value as well as a comparison with similar homes in the area
Home Values in the Area
Average Home Value in this Area
Purchase History
| Date | Buyer | Sale Price | Title Company |
|---|---|---|---|
| Dye Monique | $140,000 | Fireland Title | |
| Amawi Mohammad | $74,500 | None Available | |
| Lupica Frances S | -- | Attorney | |
| Biondo David A | -- | Attorney | |
| Biondo David A | -- | Attorney | |
| Lupica Jack A | -- | Attorney |
Source: Public Records
Mortgage History
| Date | Status | Borrower | Loan Amount |
|---|---|---|---|
| Open | Dye Monique | $137,464 | |
| Previous Owner | Amawi Mohammad | $63,325 |
Source: Public Records
Tax History Compared to Growth
Tax History
| Year | Tax Paid | Tax Assessment Tax Assessment Total Assessment is a certain percentage of the fair market value that is determined by local assessors to be the total taxable value of land and additions on the property. | Land | Improvement |
|---|---|---|---|---|
| 2025 | $2,534 | $47,748 | $9,916 | $37,832 |
| 2024 | $2,534 | $47,748 | $9,916 | $37,832 |
| 2023 | $2,534 | $47,748 | $9,916 | $37,832 |
| 2022 | $2,429 | $35,372 | $7,347 | $28,025 |
| 2021 | $2,432 | $35,372 | $7,347 | $28,025 |
| 2020 | $2,495 | $35,380 | $7,350 | $28,030 |
| 2019 | $2,401 | $30,830 | $6,050 | $24,780 |
| 2018 | $2,370 | $30,830 | $6,050 | $24,780 |
| 2017 | $2,449 | $30,830 | $6,050 | $24,780 |
| 2016 | $2,451 | $32,780 | $6,050 | $26,730 |
| 2015 | $2,449 | $32,780 | $6,050 | $26,730 |
| 2014 | $2,430 | $32,780 | $6,050 | $26,730 |
| 2013 | $2,379 | $32,780 | $6,050 | $26,730 |
Source: Public Records
Map
Nearby Homes
- 625 Fulmer Ave
- 600 Hillman Rd Unit 602
- 594 Hillman Rd Unit 596
- 586 Hillman Rd
- 597 Hillman Rd
- 515 Hillman Rd
- 490 Stephens Rd
- 560 Massillon Rd
- 427 Fulmer Ave
- 1629 Wildon Ave
- 406 Baldwin Rd
- 0 Essex St
- 452 Herbert Rd
- 1832 Springfield Center Rd
- 1549 Merrill Ave
- 1835 Penthley Ave
- 2077 Coleman Ave
- 805 Utica Ave
- 198 Hilbish Ave
- 2305 E Waterloo Rd
- 639 Fulmer Ave
- 635 Fulmer Ave
- 633 Fulmer Ave Unit 635
- 631 Fulmer Ave
- 629 Fulmer Ave Unit 631
- 625 Fulmer Ave
- 622 Stephens Rd
- 620 Stephens Rd
- 628 Stephens Rd
- 616 Stephens Rd
- 640 Fulmer Ave
- 618 Stephens Rd
- 623 & 1 2 Fulmer Ave
- 636 Fulmer Ave
- 623 Fulmer Ave
- 623 1/2 Fulmer Ave
- 1877 Triplett Blvd
- 632 Fulmer Ave
- 628 Fulmer Ave
- 617 Fulmer Ave