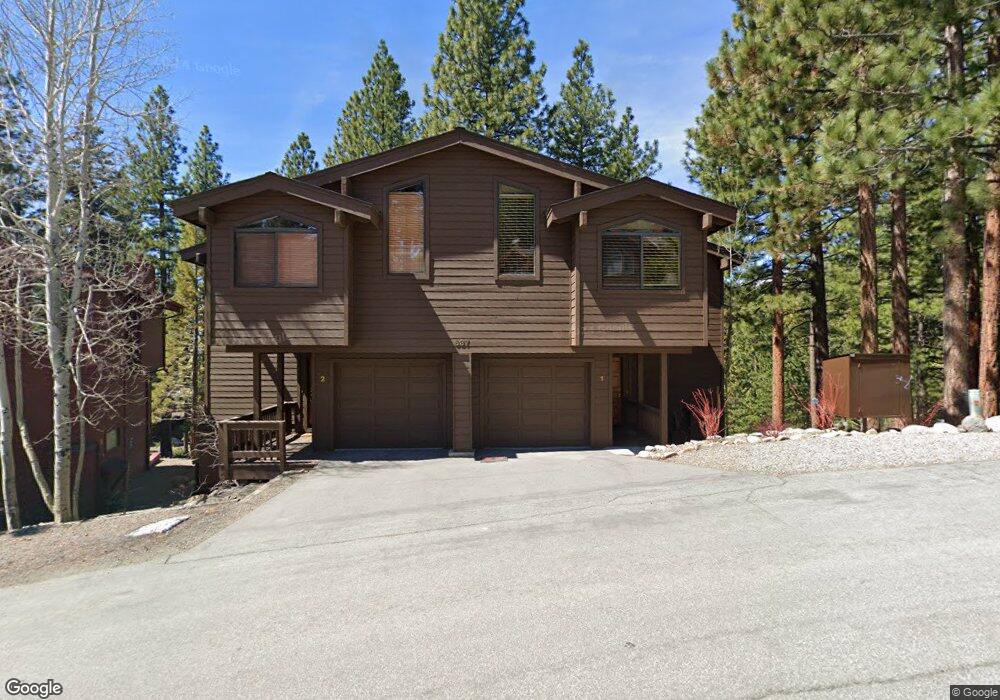
637 Lariat Cir Unit 4 Incline Village, NV 89451
Estimated Value: $1,457,000 - $1,627,000
3
Beds
3
Baths
2,231
Sq Ft
$702/Sq Ft
Est. Value
About This Home
This home is located at 637 Lariat Cir Unit 4, Incline Village, NV 89451 and is currently estimated at $1,565,321, approximately $701 per square foot. 637 Lariat Cir Unit 4 is a home located in Washoe County with nearby schools including Incline Elementary School, Incline Middle School, and Incline High School.
Ownership History
Date
Name
Owned For
Owner Type
Purchase Details
Closed on
Nov 27, 2007
Sold by
Roumasset James and Kirton Jane F
Bought by
Roumasset James and James Roumasset Trust
Current Estimated Value
Purchase Details
Closed on
Jan 12, 1999
Sold by
Monozon Michael C
Bought by
Roumasset James A and Kirton Jane F
Home Financials for this Owner
Home Financials are based on the most recent Mortgage that was taken out on this home.
Original Mortgage
$325,000
Outstanding Balance
$74,474
Interest Rate
6.62%
Estimated Equity
$1,490,847
Purchase Details
Closed on
Nov 11, 1996
Sold by
Monozon Michael
Bought by
Monozon Michael C and Michael C Monozon Trust
Purchase Details
Closed on
Mar 28, 1996
Sold by
Brown Gere Ellen
Bought by
Monozon Michael
Home Financials for this Owner
Home Financials are based on the most recent Mortgage that was taken out on this home.
Original Mortgage
$150,000
Interest Rate
6.98%
Create a Home Valuation Report for This Property
The Home Valuation Report is an in-depth analysis detailing your home's value as well as a comparison with similar homes in the area
Home Values in the Area
Average Home Value in this Area
Purchase History
| Date | Buyer | Sale Price | Title Company |
|---|---|---|---|
| Roumasset James | -- | None Available | |
| Roumasset James A | $448,500 | Stewart Title Company | |
| Monozon Michael C | -- | -- | |
| Monozon Michael | $470,000 | First American Title Co |
Source: Public Records
Mortgage History
| Date | Status | Borrower | Loan Amount |
|---|---|---|---|
| Open | Roumasset James A | $325,000 | |
| Previous Owner | Monozon Michael | $150,000 |
Source: Public Records
Tax History Compared to Growth
Tax History
| Year | Tax Paid | Tax Assessment Tax Assessment Total Assessment is a certain percentage of the fair market value that is determined by local assessors to be the total taxable value of land and additions on the property. | Land | Improvement |
|---|---|---|---|---|
| 2025 | $5,007 | $214,452 | $126,665 | $87,787 |
| 2024 | $5,007 | $200,051 | $108,465 | $91,586 |
| 2023 | $4,880 | $196,483 | $115,185 | $81,298 |
| 2022 | $5,076 | $161,909 | $86,835 | $75,074 |
| 2021 | $4,951 | $132,553 | $57,890 | $74,663 |
| 2020 | $4,878 | $132,321 | $57,890 | $74,431 |
| 2019 | $4,760 | $128,198 | $53,550 | $74,648 |
| 2018 | $4,646 | $116,600 | $43,785 | $72,815 |
| 2017 | $4,535 | $115,869 | $43,785 | $72,084 |
| 2016 | $4,441 | $112,841 | $39,095 | $73,746 |
| 2015 | $4,433 | $107,397 | $35,525 | $71,872 |
| 2014 | $4,328 | $105,892 | $33,110 | $72,782 |
| 2013 | -- | $98,741 | $25,480 | $73,261 |
Source: Public Records
Map
Nearby Homes
- 326 Aspen Leaf Ln
- 609 Lariat Cir Unit 2
- 325 Woodridge Way
- 672 Tyner Way
- 633 2nd Creek Dr
- 572 Rockrose Ct
- 689 Tyner Way
- 580 Jackpine Ln
- 650 Martis Peak Rd
- 727 Kelly Dr
- 573 Knotty Pine Dr
- 628 Martis Peak Rd
- 607 Crystal Peak Rd
- 581 Tyner Way
- 736 Kelly Dr
- 701 Martis Peak Rd
- 590 Fallen Leaf Way
- 563 Knotty Pine Dr
- 725 Lynda Ct
- 106 Slott Peak
- 637 Lariat Cir Unit 2
- 639 Lariat Cir
- 644 Tyner Way
- 636 Lariat Cir
- 635 Lariat Cir
- 650 Tyner Way
- 633 Lariat Cir
- 633 Lariat Cir
- 654 Tyner Way
- 639 Tyner Way
- 643 Lariat Cir
- 641 Tyner Way
- 634 Lariat Cir
- 592 Lariat Cir
- 643 Tyner Way
- 593 Lariat Cir
- 338 Woodridge Way
- 337 Woodridge Way
- 631 Lariat Cir
- 635 Tyner Way