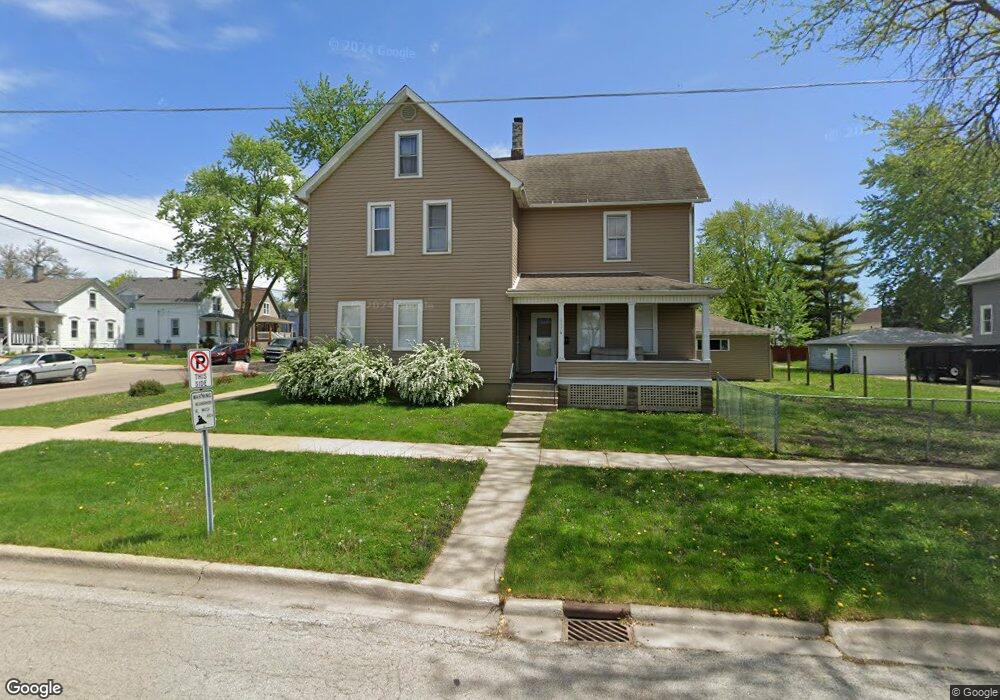
637 N Root St Aurora, IL 60505
Pigeon Hill NeighborhoodEstimated Value: $262,000 - $385,000
4
Beds
--
Bath
2,240
Sq Ft
$142/Sq Ft
Est. Value
About This Home
This home is located at 637 N Root St, Aurora, IL 60505 and is currently estimated at $317,122, approximately $141 per square foot. 637 N Root St is a home located in Kane County with nearby schools including Nicholas A Hermes Elementary School, Simmons Middle School, and East Aurora High School.
Ownership History
Date
Name
Owned For
Owner Type
Purchase Details
Closed on
Jun 2, 2025
Sold by
Flores Luis and Flores Maria L
Bought by
Luis Flores Llc - Series 637 N Root
Current Estimated Value
Purchase Details
Closed on
Oct 29, 1999
Sold by
The Old Second National Bank Of Aurora
Bought by
Flores Maria L and Flores Luis
Purchase Details
Closed on
Mar 31, 1995
Sold by
Spilman Lewis B and Spilman Jeanette A
Bought by
Old Second National Bank Of Aurora
Create a Home Valuation Report for This Property
The Home Valuation Report is an in-depth analysis detailing your home's value as well as a comparison with similar homes in the area
Home Values in the Area
Average Home Value in this Area
Purchase History
| Date | Buyer | Sale Price | Title Company |
|---|---|---|---|
| Luis Flores Llc - Series 637 N Root | -- | None Listed On Document | |
| Flores Maria L | $68,000 | Chicago Title Insurance Co | |
| Old Second National Bank Of Aurora | -- | -- |
Source: Public Records
Tax History Compared to Growth
Tax History
| Year | Tax Paid | Tax Assessment Tax Assessment Total Assessment is a certain percentage of the fair market value that is determined by local assessors to be the total taxable value of land and additions on the property. | Land | Improvement |
|---|---|---|---|---|
| 2024 | $6,153 | $89,763 | $12,816 | $76,947 |
| 2023 | $5,993 | $80,203 | $11,451 | $68,752 |
| 2022 | $5,560 | $73,178 | $10,448 | $62,730 |
| 2021 | $5,500 | $68,129 | $9,727 | $58,402 |
| 2020 | $5,263 | $63,282 | $9,035 | $54,247 |
| 2019 | $4,839 | $54,912 | $8,371 | $46,541 |
| 2018 | $4,512 | $49,547 | $7,743 | $41,804 |
| 2017 | $4,588 | $46,783 | $7,134 | $39,649 |
| 2016 | $4,777 | $45,400 | $7,194 | $38,206 |
| 2015 | -- | $39,469 | $6,186 | $33,283 |
| 2014 | -- | $37,695 | $5,685 | $32,010 |
| 2013 | -- | $39,927 | $6,035 | $33,892 |
Source: Public Records
Map
Nearby Homes
- 689 N Lincoln Ave
- 628 Monroe St
- 608 Front St
- 773 Aurora Ave
- 231-233 Williams St
- 971 Solfisburg Ave
- 1009 Assell Ave
- 729 Claim St
- 1105 Indian Ave
- 1147 Rural St Unit 41
- 172 N East Ave
- 1038 Liberty St
- 222 Grand Ave
- 1220 Mitchell Rd
- 574 E Galena Blvd
- 418 W Illinois Ave
- 415 Blackhawk St
- 451 Turner Rd
- 519 N View St
- 441 N View St