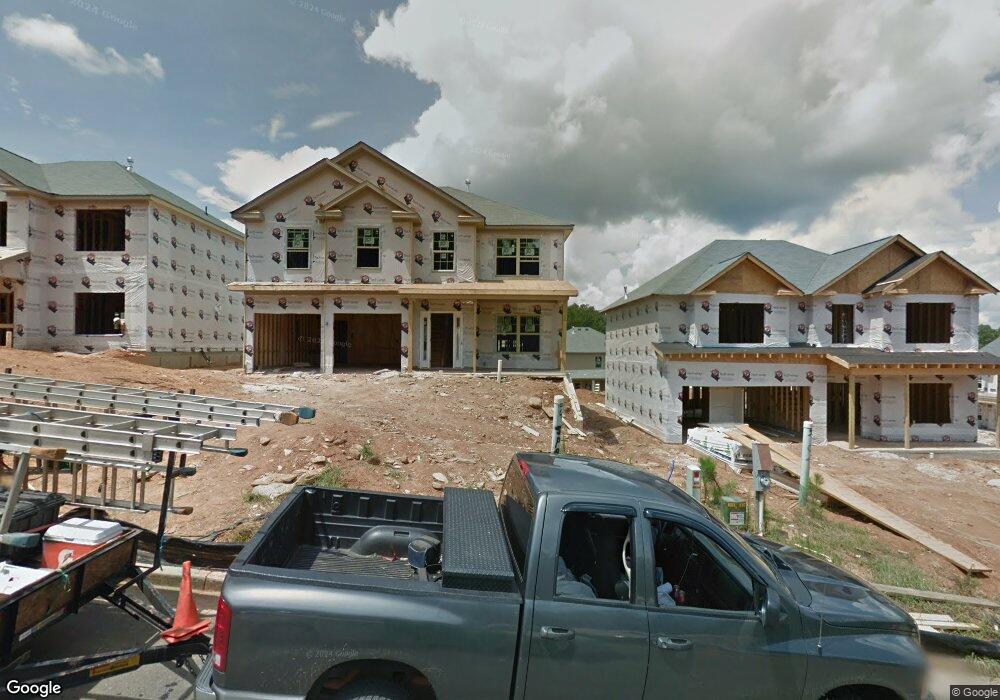
637 Ocean Ave Canton, GA 30114
Estimated Value: $380,000 - $410,478
4
Beds
3
Baths
2,295
Sq Ft
$172/Sq Ft
Est. Value
About This Home
This home is located at 637 Ocean Ave, Canton, GA 30114 and is currently estimated at $395,239, approximately $172 per square foot. 637 Ocean Ave is a home located in Cherokee County with nearby schools including Hasty Elementary School Fine Arts Academy, Teasley Middle School, and Cherokee High School.
Ownership History
Date
Name
Owned For
Owner Type
Purchase Details
Closed on
Aug 20, 2020
Sold by
Mans Mark
Bought by
Mans Mary
Current Estimated Value
Home Financials for this Owner
Home Financials are based on the most recent Mortgage that was taken out on this home.
Original Mortgage
$234,390
Outstanding Balance
$207,452
Interest Rate
3%
Mortgage Type
New Conventional
Estimated Equity
$187,787
Purchase Details
Closed on
Sep 18, 2013
Sold by
Peachtree Communities At S
Bought by
Mans Mark Daniel
Home Financials for this Owner
Home Financials are based on the most recent Mortgage that was taken out on this home.
Original Mortgage
$171,612
Interest Rate
4.57%
Mortgage Type
VA
Purchase Details
Closed on
Mar 18, 2013
Sold by
Summerwalk Grp Llc
Bought by
Peachtree Communities At Summe
Purchase Details
Closed on
Mar 1, 2012
Sold by
Peachtree Communities Llc
Bought by
Summerwalk Grp Llc
Create a Home Valuation Report for This Property
The Home Valuation Report is an in-depth analysis detailing your home's value as well as a comparison with similar homes in the area
Home Values in the Area
Average Home Value in this Area
Purchase History
| Date | Buyer | Sale Price | Title Company |
|---|---|---|---|
| Mans Mary | $268,000 | -- | |
| Mans Mark Daniel | $168,000 | -- | |
| Peachtree Communities At Summe | $102,000 | -- | |
| Summerwalk Grp Llc | $1,829,762 | -- |
Source: Public Records
Mortgage History
| Date | Status | Borrower | Loan Amount |
|---|---|---|---|
| Open | Mans Mary | $234,390 | |
| Previous Owner | Mans Mark Daniel | $171,612 |
Source: Public Records
Tax History
| Year | Tax Paid | Tax Assessment Tax Assessment Total Assessment is a certain percentage of the fair market value that is determined by local assessors to be the total taxable value of land and additions on the property. | Land | Improvement |
|---|---|---|---|---|
| 2025 | $4,216 | $160,760 | $34,000 | $126,760 |
| 2024 | $4,219 | $161,280 | $34,000 | $127,280 |
| 2023 | $3,782 | $163,200 | $34,000 | $129,200 |
| 2022 | $3,493 | $130,280 | $28,800 | $101,480 |
| 2021 | $3,085 | $105,360 | $22,400 | $82,960 |
| 2020 | $2,829 | $92,680 | $20,000 | $72,680 |
| 2019 | $2,706 | $88,600 | $20,000 | $68,600 |
| 2018 | $2,575 | $83,840 | $16,800 | $67,040 |
| 2017 | $1,893 | $197,700 | $16,800 | $62,280 |
| 2016 | $1,893 | $183,900 | $16,800 | $56,760 |
| 2015 | $1,789 | $172,300 | $10,200 | $58,720 |
| 2014 | $2,156 | $167,300 | $12,800 | $54,120 |
Source: Public Records
Map
Nearby Homes
- 515 Sunset St
- 176 Fred Bishop Dr
- 395 Heard Rd
- 301 Stoney Hollow Rd
- 101 Rolling Hills Place
- 665 Page Place
- 600 Page Place
- 123 Rolling Hills Place
- 2023 Fate Conn Rd
- 218 Jefferson Ave
- 637 Sunflower Dr
- 129 Rex Ave
- 0 Bluffs Pkwy Unit 10648203
- 0 Bluffs Pkwy Unit 7684943
- 146 Rolling Hills Place
- 255 Jefferson Ave
- 616 Breedlove Rd
- 674 Valdosta Dr
- 321 Arch Dr
- 213 Prescott Cir
- 635 Ocean Ave
- 639 Ocean Ave
- 633 Ocean Ave Unit 266
- 633 Ocean Ave
- 633 Ocean Ave
- 643 Ocean Ave
- 645 Ocean Ave Unit 645
- 645 Ocean Ave
- 645 Ocean Ave
- 641 Ocean Ave
- 647 Ocean Ave Unit 259
- 647 Ocean Ave
- 631 Ocean Ave Unit 267
- 631 Ocean Ave
- 658 Ocean Ave
- 646 Ocean Ave
- 656 Ocean Ave Unit 110
- 656 Ocean Ave
- 642 Ocean Ave
- 648 Ocean Ave Unit 114
Your Personal Tour Guide
Ask me questions while you tour the home.