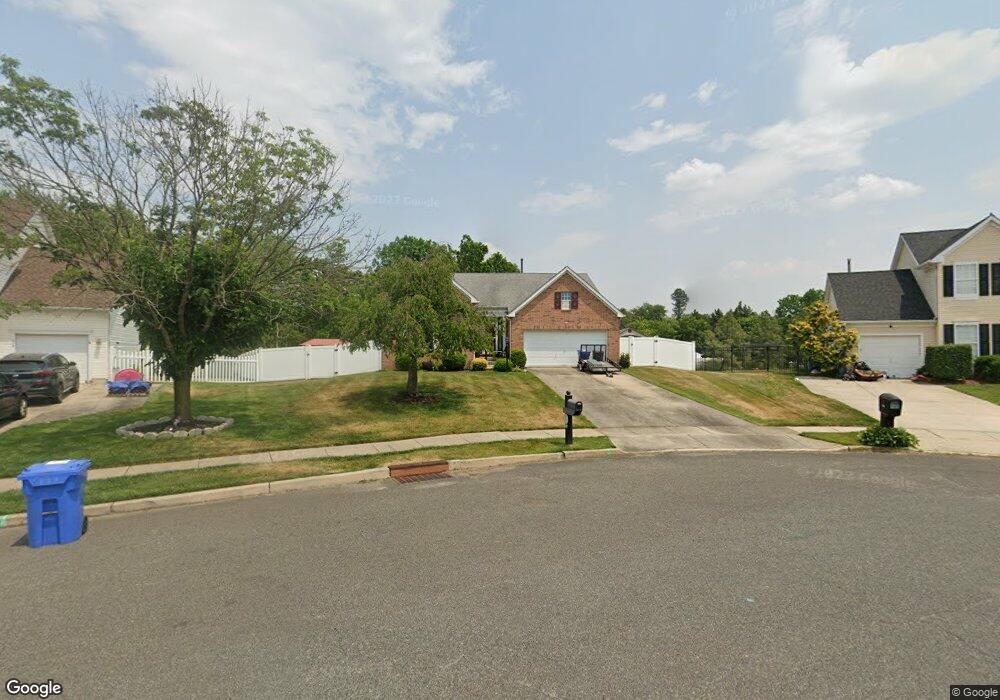
637 Ronald Ave Glassboro, NJ 08028
Estimated Value: $404,000 - $429,000
4
Beds
3
Baths
1,547
Sq Ft
$267/Sq Ft
Est. Value
About This Home
This home is located at 637 Ronald Ave, Glassboro, NJ 08028 and is currently estimated at $413,378, approximately $267 per square foot. 637 Ronald Ave is a home located in Gloucester County with nearby schools including J Harvey Rodgers School, Dorothy L Bullock Elementary, and Glassboro Intermediate School.
Ownership History
Date
Name
Owned For
Owner Type
Purchase Details
Closed on
Dec 17, 2010
Sold by
Summins Wanda
Bought by
Kearns William A and Kearns Eleanor
Current Estimated Value
Purchase Details
Closed on
May 8, 2010
Sold by
Summins Wanda
Bought by
Summins Wanda
Purchase Details
Closed on
Nov 8, 2007
Sold by
Summins Edwin J and Summins Wanda
Bought by
Summins Wanda
Purchase Details
Closed on
Jul 9, 1997
Sold by
Summins Edwin J and Summins Wanda
Bought by
Summins Edwin J and Summins Wanda
Purchase Details
Closed on
Nov 30, 1994
Sold by
The Ryland Group Inc
Bought by
Summins Edwin J and Summins Wanda
Purchase Details
Closed on
Aug 9, 1994
Sold by
Landscope Inc
Bought by
The Ryland Group Inc
Create a Home Valuation Report for This Property
The Home Valuation Report is an in-depth analysis detailing your home's value as well as a comparison with similar homes in the area
Home Values in the Area
Average Home Value in this Area
Purchase History
| Date | Buyer | Sale Price | Title Company |
|---|---|---|---|
| Kearns William A | $200,000 | Foundation Title Llc | |
| Summins Wanda | -- | None Available | |
| Summins Wanda | -- | None Available | |
| Summins Edwin J | -- | -- | |
| Summins Edwin J | $185,257 | -- | |
| The Ryland Group Inc | $37,000 | Commonwealth Land Title Ins |
Source: Public Records
Tax History Compared to Growth
Tax History
| Year | Tax Paid | Tax Assessment Tax Assessment Total Assessment is a certain percentage of the fair market value that is determined by local assessors to be the total taxable value of land and additions on the property. | Land | Improvement |
|---|---|---|---|---|
| 2025 | $7,040 | $200,000 | $70,100 | $129,900 |
| 2024 | $6,998 | $200,000 | $70,100 | $129,900 |
| 2023 | $6,998 | $200,000 | $70,100 | $129,900 |
| 2022 | $6,928 | $200,000 | $70,100 | $129,900 |
| 2021 | $6,283 | $200,000 | $70,100 | $129,900 |
| 2020 | $7,086 | $200,000 | $70,100 | $129,900 |
| 2019 | $7,098 | $200,000 | $70,100 | $129,900 |
| 2018 | $7,102 | $200,000 | $70,100 | $129,900 |
| 2017 | $7,136 | $200,000 | $70,100 | $129,900 |
| 2016 | $6,930 | $200,000 | $70,100 | $129,900 |
| 2015 | $6,780 | $200,000 | $70,100 | $129,900 |
| 2014 | $6,626 | $200,000 | $70,100 | $129,900 |
Source: Public Records
Map
Nearby Homes