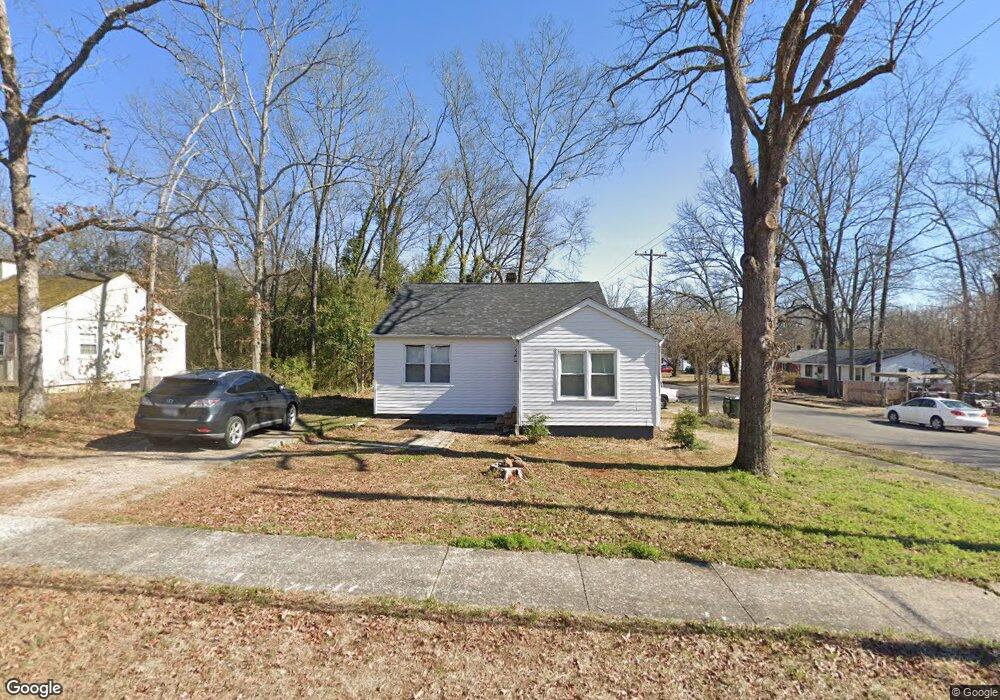
637 S Spruce St Rock Hill, SC 29730
Estimated Value: $147,976 - $203,000
2
Beds
1
Bath
914
Sq Ft
$187/Sq Ft
Est. Value
About This Home
This home is located at 637 S Spruce St, Rock Hill, SC 29730 and is currently estimated at $170,494, approximately $186 per square foot. 637 S Spruce St is a home located in York County with nearby schools including Rawlinson Road Middle School, South Pointe High School, and Providence Classical School.
Ownership History
Date
Name
Owned For
Owner Type
Purchase Details
Closed on
Nov 30, 2022
Sold by
York County
Bought by
Riva Holdings Llc
Current Estimated Value
Purchase Details
Closed on
Aug 5, 2015
Sold by
Royal Flush Investment Group Llc
Bought by
Royal Flush Properties Llc
Home Financials for this Owner
Home Financials are based on the most recent Mortgage that was taken out on this home.
Original Mortgage
$460,000
Interest Rate
4.09%
Mortgage Type
Stand Alone Refi Refinance Of Original Loan
Purchase Details
Closed on
Oct 28, 2010
Sold by
Cheema Nazir A and Cheema Virginia A
Bought by
Royal Flush Investment Group Llc
Home Financials for this Owner
Home Financials are based on the most recent Mortgage that was taken out on this home.
Original Mortgage
$21,100
Interest Rate
4.37%
Mortgage Type
New Conventional
Purchase Details
Closed on
Aug 7, 2008
Sold by
Weinbach Mark W
Bought by
Cheema Nazir A and Cheema Virginia A
Create a Home Valuation Report for This Property
The Home Valuation Report is an in-depth analysis detailing your home's value as well as a comparison with similar homes in the area
Home Values in the Area
Average Home Value in this Area
Purchase History
| Date | Buyer | Sale Price | Title Company |
|---|---|---|---|
| Riva Holdings Llc | $675,000 | -- | |
| Royal Flush Properties Llc | -- | -- | |
| Royal Flush Investment Group Llc | $25,000 | -- | |
| Cheema Nazir A | $31,100 | -- |
Source: Public Records
Mortgage History
| Date | Status | Borrower | Loan Amount |
|---|---|---|---|
| Previous Owner | Royal Flush Properties Llc | $460,000 | |
| Previous Owner | Royal Flush Investment Group Llc | $21,100 |
Source: Public Records
Tax History Compared to Growth
Tax History
| Year | Tax Paid | Tax Assessment Tax Assessment Total Assessment is a certain percentage of the fair market value that is determined by local assessors to be the total taxable value of land and additions on the property. | Land | Improvement |
|---|---|---|---|---|
| 2024 | $1,515 | $3,423 | $960 | $2,463 |
| 2023 | $1,517 | $3,423 | $960 | $2,463 |
| 2022 | $1,446 | $3,423 | $960 | $2,463 |
| 2021 | -- | $3,423 | $960 | $2,463 |
| 2020 | $1,417 | $3,423 | $0 | $0 |
| 2019 | $1,273 | $3,000 | $0 | $0 |
| 2018 | $1,254 | $3,000 | $0 | $0 |
| 2017 | $1,211 | $3,000 | $0 | $0 |
| 2016 | $1,187 | $3,000 | $0 | $0 |
| 2014 | $1,127 | $3,000 | $960 | $2,040 |
| 2013 | $1,127 | $2,970 | $840 | $2,130 |
Source: Public Records
Map
Nearby Homes
- 720 Arch Dr
- 560 Walnut St
- 416 Locust St Unit 8
- 368 Chestnut St
- 808 Saluda St
- 658 Rockwood Dr
- 301 S Spruce St
- 758 Jefferson Ave
- 757 Carolina Ave
- 905 Saluda St
- 621 Flint St
- 459 Green St
- 406 Rich St
- 617 Jennings Rd Unit 14
- 606 E Black St
- 987 Pebble Rd
- 724 Chestnut St
- 402 Keels Ave
- 974 Pebble Rd
- 711 Green St
- 515 State St
- 625 S Spruce St
- 512 State St
- 515 State Street Extension
- 504 State Street Extension
- 621 S Spruce St
- 512 State Street Extension
- 519 State Street Extension
- 519 State St
- 632 S Spruce St
- 619 S Spruce St
- 711 S Spruce St
- 526 State St
- 626 S Spruce St
- 526 State Street Extension
- 708 S Spruce St
- 715 S Spruce St
- 527 State Street Extension
- 622 S Spruce St
- 530 State Street Extension