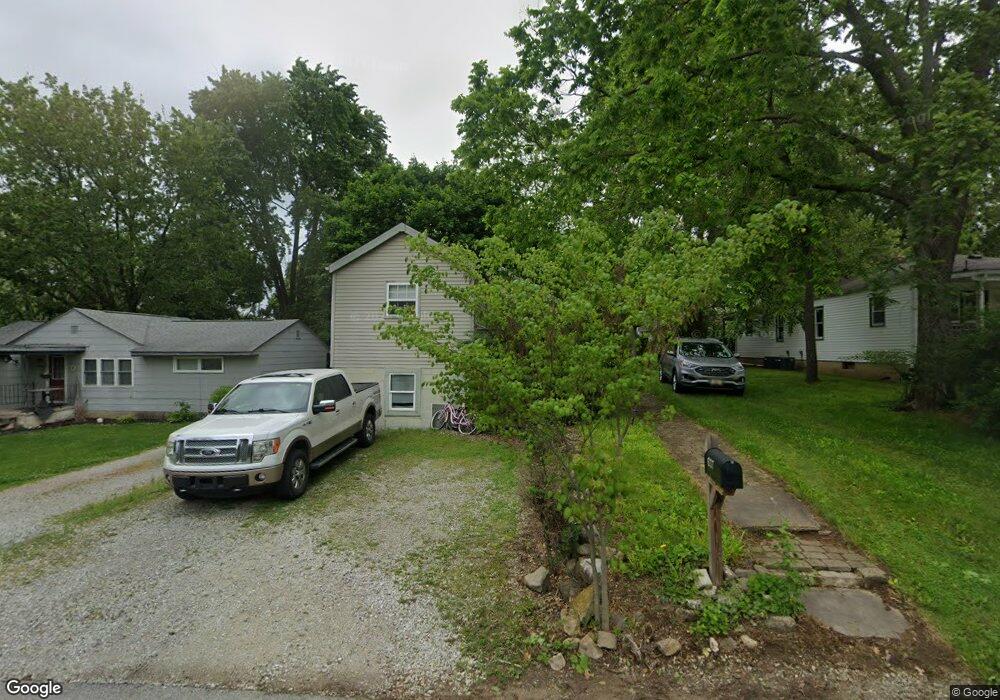
637 Silver St Pendleton, IN 46064
Estimated Value: $194,000 - $280,000
3
Beds
1
Bath
714
Sq Ft
$326/Sq Ft
Est. Value
About This Home
This home is located at 637 Silver St, Pendleton, IN 46064 and is currently estimated at $232,928, approximately $326 per square foot. 637 Silver St is a home located in Madison County with nearby schools including Pendleton Elementary School and Pendleton Heights Middle School.
Ownership History
Date
Name
Owned For
Owner Type
Purchase Details
Closed on
May 10, 2012
Sold by
Fannie Mae
Bought by
Horine Lance C
Current Estimated Value
Home Financials for this Owner
Home Financials are based on the most recent Mortgage that was taken out on this home.
Original Mortgage
$28,000
Outstanding Balance
$4,115
Interest Rate
6.25%
Mortgage Type
Adjustable Rate Mortgage/ARM
Estimated Equity
$228,813
Purchase Details
Closed on
Jan 31, 2012
Sold by
Wells Fargo Bank
Bought by
Federal National Mortgage Association
Purchase Details
Closed on
Nov 18, 2011
Sold by
Daniel Ryan K
Bought by
Wells Fargo Bank N A
Purchase Details
Closed on
Sep 28, 2006
Sold by
Shanks Adam M and Shanks Kimber L
Bought by
Daniel Ryan K and Green Madison R
Home Financials for this Owner
Home Financials are based on the most recent Mortgage that was taken out on this home.
Original Mortgage
$98,000
Interest Rate
6.49%
Mortgage Type
New Conventional
Create a Home Valuation Report for This Property
The Home Valuation Report is an in-depth analysis detailing your home's value as well as a comparison with similar homes in the area
Home Values in the Area
Average Home Value in this Area
Purchase History
| Date | Buyer | Sale Price | Title Company |
|---|---|---|---|
| Horine Lance C | -- | None Available | |
| Federal National Mortgage Association | -- | None Available | |
| Wells Fargo Bank N A | $63,000 | None Available | |
| Daniel Ryan K | -- | -- |
Source: Public Records
Mortgage History
| Date | Status | Borrower | Loan Amount |
|---|---|---|---|
| Open | Horine Lance C | $28,000 | |
| Previous Owner | Daniel Ryan K | $98,000 |
Source: Public Records
Tax History
| Year | Tax Paid | Tax Assessment Tax Assessment Total Assessment is a certain percentage of the fair market value that is determined by local assessors to be the total taxable value of land and additions on the property. | Land | Improvement |
|---|---|---|---|---|
| 2025 | $2,212 | $120,000 | $35,600 | $84,400 |
| 2024 | $2,212 | $110,600 | $35,600 | $75,000 |
| 2023 | $2,038 | $101,900 | $33,800 | $68,100 |
| 2022 | $2,002 | $100,100 | $32,000 | $68,100 |
| 2021 | $1,892 | $94,600 | $32,000 | $62,600 |
| 2020 | $1,946 | $91,300 | $30,500 | $60,800 |
| 2019 | $1,832 | $91,600 | $30,500 | $61,100 |
| 2018 | $1,744 | $87,200 | $30,500 | $56,700 |
| 2017 | $1,626 | $81,300 | $28,200 | $53,100 |
| 2016 | $1,650 | $82,500 | $28,200 | $54,300 |
| 2014 | $1,500 | $75,000 | $28,200 | $46,800 |
| 2013 | $1,500 | $75,500 | $28,200 | $47,300 |
Source: Public Records
Map
Nearby Homes
- 644 Center St
- 621 S Silver St
- 720 S Broadway St
- 460 E Madison Ave
- 9806 Olympic Blvd
- 8093 Ridge Line Dr
- 637 Kilmore Dr
- 8094 Ridge Line Dr
- 305 Waterford Ln
- 7160 Murph Way
- 6758 Honeysuckle Way
- 315 W High St
- 227 Jefferson St
- 238 Jefferson St
- 513 W State St
- 110 W Water St
- 217 Garden Dr
- 296 Evening Bay Ct
- 400 E Water St
- 201 N East St
Your Personal Tour Guide
Ask me questions while you tour the home.