637 West Dr Channelview, TX 77530
Estimated Value: $267,000 - $370,035
About This Home
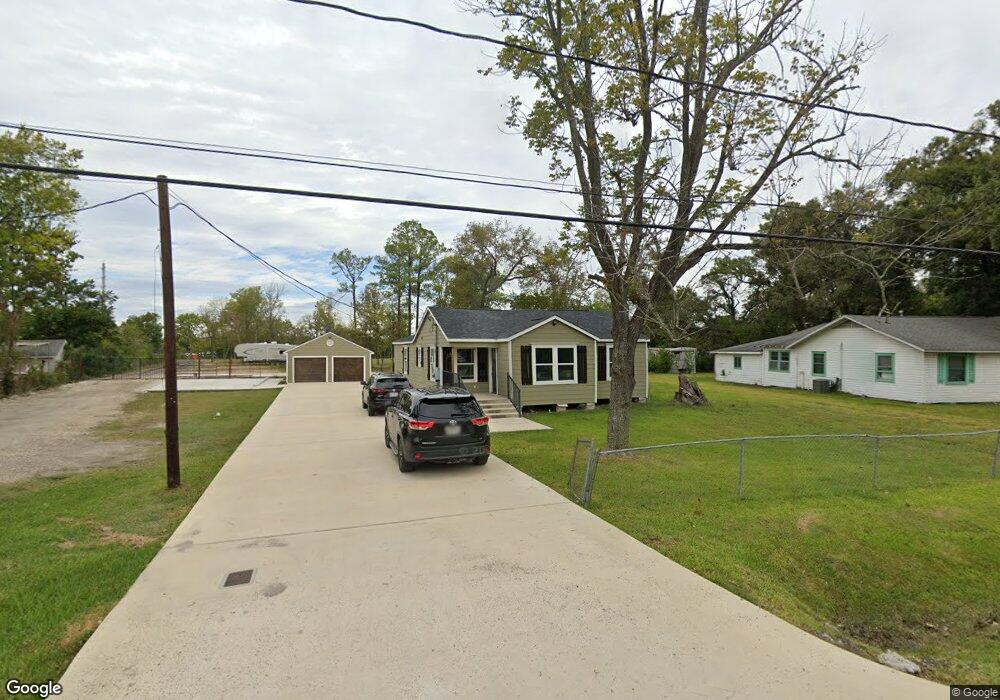
This home is located at 637 West Dr, Channelview, TX 77530 and is currently estimated at $312,509, approximately $195 per square foot. 637 West Dr is a home located in Harris County with nearby schools including Channelview High School and Family Christian Academy.
Ownership History
We collect this data history from publicly available records. To have your information removed, we recommend requesting removal directly through your county’s website.
Purchase Details
Home Financials for this Owner
Home Financials are based on the most recent Mortgage that was taken out on this home.Purchase Details
Home Values in the Area
Average Home Value in this Area
Purchase History
We collect this data history from publicly available records. To have your information removed, we recommend requesting removal directly through your county’s website.
| Date | Buyer | Sale Price | Title Company |
|---|---|---|---|
| -- | Fidelity National Title | ||
| -- | None Available |
Mortgage History
We collect this data history from publicly available records. To have your information removed, we recommend requesting removal directly through your county’s website.
| Date | Status | Borrower | Loan Amount |
|---|---|---|---|
| Open | $157,500 |
Tax History
We collect this data history from publicly available records. To have your information removed, we recommend requesting removal directly through your county’s website.
| Year | Tax Paid | Tax Assessment Tax Assessment Total Assessment is a certain percentage of the fair market value that is determined by local assessors to be the total taxable value of land and additions on the property. | Land | Improvement |
|---|---|---|---|---|
| 2025 | $6,809 | $337,891 | $244,572 | $93,319 |
| 2024 | $6,204 | $304,286 | $214,001 | $90,285 |
| 2023 | $6,204 | $315,331 | $214,001 | $101,330 |
| 2022 | $6,292 | $270,328 | $183,429 | $86,899 |
| 2021 | $5,531 | $228,281 | $122,286 | $105,995 |
| 2020 | $4,794 | $186,686 | $110,057 | $76,629 |
| 2019 | $4,731 | $180,141 | $110,057 | $70,084 |
| 2018 | $0 | $140,383 | $110,057 | $30,326 |
| 2017 | $3,691 | $140,383 | $76,429 | $63,954 |
| 2016 | $3,691 | $140,383 | $76,429 | $63,954 |
| 2015 | $352 | $135,263 | $76,429 | $58,834 |
| 2014 | $352 | $133,243 | $76,429 | $56,814 |
Map
- 666 Overbluff St
- 707 Doncrest St
- 14902 Woodford St
- 819 Donfield St
- 827 Dondell St
- 634 Bright Penny Ln
- 730 Stonyridge St
- 623 Rockbrook Dr
- 627 Rockbrook Dr
- 830 Stonyridge St
- 15102 Sheffield Terrace
- 830 Hollycrest St
- 14731 Conover Ct
- 722 Canna St
- 15209 Sheffield Terrace
- 916 Littleport Ln
- 14927 Sheffield Terrace
- 946 Pennygent Ln
- 15258 Ferness Ln
- 14625 Longview St
- 15001 N Brentwood St
- 630 West Dr
- 633 West Dr
- 15003 N Brentwood St
- 15005 N Brentwood St
- 15002 N Brentwood St
- 627 West Dr
- 15006 N Brentwood St
- 628 West Dr
- 625 West Dr
- 626 West Dr
- 15009 N Brentwood St
- 623 West Dr
- 15016 N Brentwood St
- 622 West Dr
- 658 Overbluff St
- 654 Overbluff St
- 662 Overbluff St
- 650 Overbluff St
- 646 Overbluff St
Ask me questions while you tour the home.