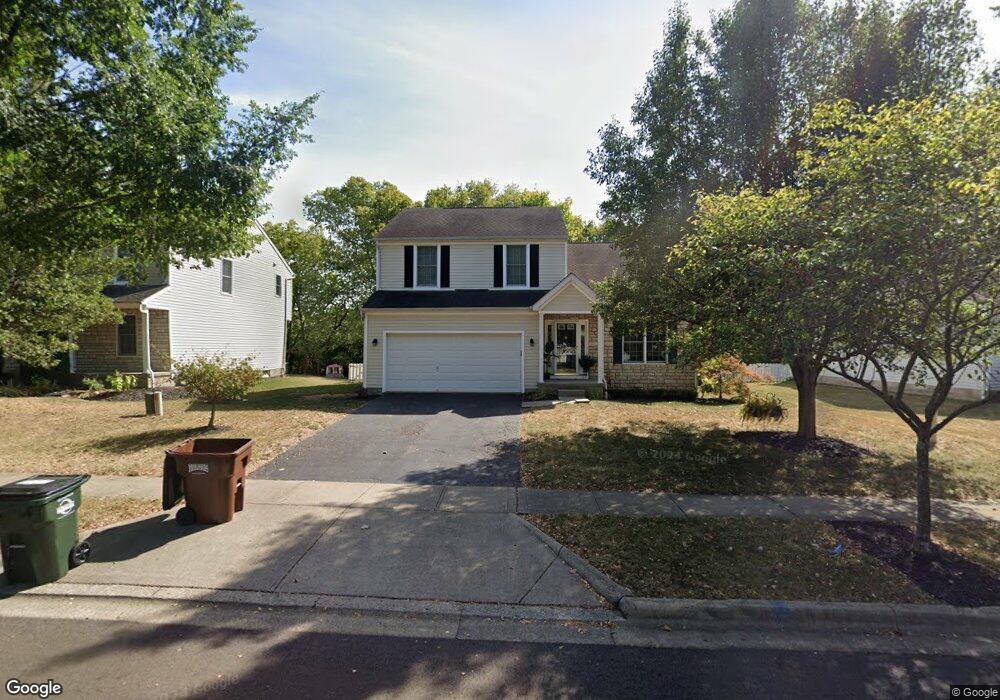
6373 Streams End Dr Unit 345 Canal Winchester, OH 43110
Estimated Value: $358,000 - $374,000
3
Beds
3
Baths
1,900
Sq Ft
$193/Sq Ft
Est. Value
About This Home
This home is located at 6373 Streams End Dr Unit 345, Canal Winchester, OH 43110 and is currently estimated at $366,304, approximately $192 per square foot. 6373 Streams End Dr Unit 345 is a home located in Fairfield County with nearby schools including Bloom Carroll Primary School, Bloom Carroll Intermediate School, and Bloom-Carroll Middle School.
Ownership History
Date
Name
Owned For
Owner Type
Purchase Details
Closed on
Oct 26, 2018
Sold by
Investment Brothers Llc
Bought by
Wheeler Jason T
Current Estimated Value
Home Financials for this Owner
Home Financials are based on the most recent Mortgage that was taken out on this home.
Original Mortgage
$222,687
Outstanding Balance
$195,408
Interest Rate
4.7%
Mortgage Type
VA
Estimated Equity
$170,896
Purchase Details
Closed on
Jun 12, 2018
Sold by
Barby Roger D and Wells Fargo Bank
Bought by
Investment Brothers Llc
Purchase Details
Closed on
Oct 29, 2002
Sold by
Dominion Homes Inc
Bought by
Darby Roger D and Darby Linda Y
Home Financials for this Owner
Home Financials are based on the most recent Mortgage that was taken out on this home.
Original Mortgage
$177,838
Interest Rate
6.29%
Mortgage Type
FHA
Create a Home Valuation Report for This Property
The Home Valuation Report is an in-depth analysis detailing your home's value as well as a comparison with similar homes in the area
Home Values in the Area
Average Home Value in this Area
Purchase History
| Date | Buyer | Sale Price | Title Company |
|---|---|---|---|
| Wheeler Jason T | $218,000 | Northwest Title Family Compa | |
| Investment Brothers Llc | $174,000 | None Available | |
| Darby Roger D | $179,750 | -- |
Source: Public Records
Mortgage History
| Date | Status | Borrower | Loan Amount |
|---|---|---|---|
| Open | Wheeler Jason T | $222,687 | |
| Previous Owner | Darby Roger D | $177,838 |
Source: Public Records
Tax History Compared to Growth
Tax History
| Year | Tax Paid | Tax Assessment Tax Assessment Total Assessment is a certain percentage of the fair market value that is determined by local assessors to be the total taxable value of land and additions on the property. | Land | Improvement |
|---|---|---|---|---|
| 2024 | $6,859 | $86,390 | $14,010 | $72,380 |
| 2023 | $3,542 | $86,390 | $14,010 | $72,380 |
| 2022 | $3,570 | $86,390 | $14,010 | $72,380 |
| 2021 | $3,046 | $66,970 | $11,720 | $55,250 |
| 2020 | $3,079 | $66,970 | $11,720 | $55,250 |
| 2019 | $3,089 | $66,970 | $11,720 | $55,250 |
| 2018 | $2,700 | $59,250 | $11,720 | $47,530 |
| 2017 | $2,541 | $58,230 | $10,700 | $47,530 |
| 2016 | $2,502 | $58,230 | $10,700 | $47,530 |
| 2015 | $2,476 | $56,100 | $10,700 | $45,400 |
| 2014 | $2,373 | $56,100 | $10,700 | $45,400 |
| 2013 | $2,373 | $56,100 | $10,700 | $45,400 |
Source: Public Records
Map
Nearby Homes
- Ironwood Plan at Edgewood Farms
- Aspen II Plan at Edgewood Farms
- Bradford Plan at Edgewood Farms
- Walnut Plan at Edgewood Farms
- Palmetto Plan at Edgewood Farms
- Empress Plan at Edgewood Farms
- Ashton Plan at Edgewood Farms
- Cooper Plan at Edgewood Farms
- Juniper Plan at Edgewood Farms
- Chestnut Plan at Edgewood Farms
- Norway Plan at Edgewood Farms
- Spruce Plan at Edgewood Farms
- 6458 Ashbrook Village Dr
- 207 Faulkner Dr
- 638 Faulkner Dr
- 607 Eastman Ave
- 720 Faulkner Dr
- 557 Eastman Ave
- 7559 Burgstresser Ct
- 1410 Hansberry Dr
- 6373 Streams End Dr
- 6365 Streams End Dr Unit 346
- 6383 Streams End Dr
- 6391 Streams End Dr
- 6391 Streams End Dr Unit 343
- 6357 Streams End Dr
- 6380 Streams End Dr
- 6370 Streams End Dr
- 6399 Streams End Dr
- 6352 Streams End Dr
- 6407 Streams End Dr
- 7850 Brooks Bend Ct
- 7857 Iris Ct
- 6410 Streams End Dr
- 6342 Streams End Dr
- 6415 Streams End Dr
- 6415 Streams End Dr Unit ASR340
- 7847 Brooks Bend Ct
- 7840 Brooks Bend Ct
- 6420 Streams End Dr