6374 Riverbend Dr Dayton, OH 45415
Estimated Value: $203,000 - $266,000
4
Beds
3
Baths
1,480
Sq Ft
$158/Sq Ft
Est. Value
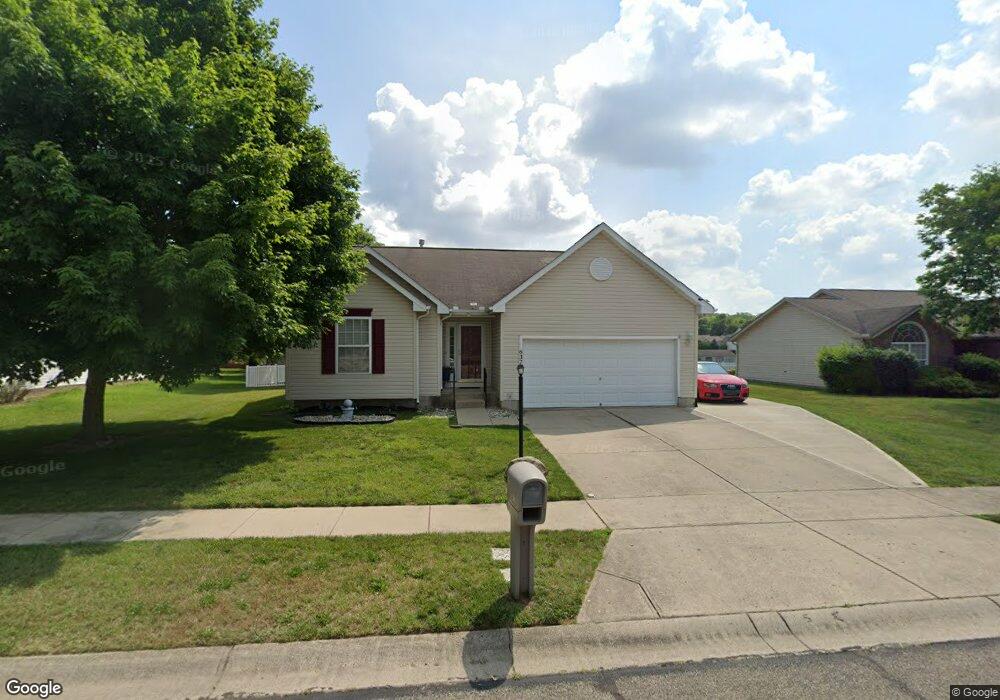
About This Home
This home is located at 6374 Riverbend Dr, Dayton, OH 45415 and is currently estimated at $233,169, approximately $157 per square foot. 6374 Riverbend Dr is a home located in Montgomery County with nearby schools including Helke Elementary School, Morton Middle School, and Butler High School.
Ownership History
Date
Name
Owned For
Owner Type
Purchase Details
Closed on
Apr 13, 2011
Sold by
Fannie Mae
Bought by
Holt John E and Holt Ralonda J
Current Estimated Value
Home Financials for this Owner
Home Financials are based on the most recent Mortgage that was taken out on this home.
Original Mortgage
$82,747
Outstanding Balance
$57,274
Interest Rate
4.87%
Mortgage Type
FHA
Estimated Equity
$175,895
Purchase Details
Closed on
Nov 16, 2009
Sold by
Weprin Deborah B
Bought by
Federal National Mortgage Association
Purchase Details
Closed on
Sep 15, 2000
Sold by
Nvr Inc
Bought by
Weprin Richard E and Weprin Deborah B
Home Financials for this Owner
Home Financials are based on the most recent Mortgage that was taken out on this home.
Original Mortgage
$115,000
Interest Rate
8.05%
Purchase Details
Closed on
Apr 24, 2000
Sold by
Riverbend Meadows Development Co Ltd
Bought by
Nvr Inc
Create a Home Valuation Report for This Property
The Home Valuation Report is an in-depth analysis detailing your home's value as well as a comparison with similar homes in the area
Home Values in the Area
Average Home Value in this Area
Purchase History
| Date | Buyer | Sale Price | Title Company |
|---|---|---|---|
| Holt John E | $84,900 | None Available | |
| Federal National Mortgage Association | $114,307 | None Available | |
| Weprin Richard E | $147,500 | -- | |
| Nvr Inc | $32,900 | -- |
Source: Public Records
Mortgage History
| Date | Status | Borrower | Loan Amount |
|---|---|---|---|
| Open | Holt John E | $82,747 | |
| Previous Owner | Weprin Richard E | $115,000 |
Source: Public Records
Tax History Compared to Growth
Tax History
| Year | Tax Paid | Tax Assessment Tax Assessment Total Assessment is a certain percentage of the fair market value that is determined by local assessors to be the total taxable value of land and additions on the property. | Land | Improvement |
|---|---|---|---|---|
| 2024 | $3,439 | $56,960 | $14,950 | $42,010 |
| 2023 | $3,439 | $56,960 | $14,950 | $42,010 |
| 2022 | $3,680 | $46,780 | $12,250 | $34,530 |
| 2021 | $3,690 | $46,780 | $12,250 | $34,530 |
| 2020 | $3,688 | $46,780 | $12,250 | $34,530 |
| 2019 | $3,928 | $44,950 | $12,250 | $32,700 |
| 2018 | $3,938 | $44,950 | $12,250 | $32,700 |
| 2017 | $3,915 | $44,950 | $12,250 | $32,700 |
| 2016 | $3,991 | $44,860 | $12,250 | $32,610 |
| 2015 | $3,680 | $44,860 | $12,250 | $32,610 |
| 2014 | $3,680 | $44,860 | $12,250 | $32,610 |
| 2012 | -- | $48,020 | $14,000 | $34,020 |
Source: Public Records
Map
Nearby Homes
- 701 Fredericksburg Dr
- 8090 Dog Leg Rd
- 270 Pamela Ave
- 6552 Stillcrest Way
- 159 Burgess Ave
- 6029 Imperial Hills Dr
- 5653 Philadelphia Dr
- 6012 Imperial Hills Dr
- 6810 Trailview Dr
- 7042 Society Ct
- 5563 Fair Valley Rd
- 5473 Fair Valley Rd
- 455 Shiloh Dr
- 6430 Oakhurst Place
- 5129 Rivers Edge Blvd
- 266 Briarcliff Rd
- 7725 Harrington Ave
- 2625 Secretariat Ct
- 7935 Harrington Ave
- 7077 Meeker Commons Ln
- 6384 Riverbend Dr
- 6364 Riverbend Dr
- 1465 Scenic River Dr
- 1473 Scenic River Dr
- 1457 Scenic River Dr
- 6394 Riverbend Dr
- 6354 Riverbend Dr
- 6381 Riverbend Dr
- 6371 Riverbend Dr
- 1481 Scenic River Dr
- 1449 Scenic River Dr
- 6391 Riverbend Dr
- 6361 Riverbend Dr
- 6404 Riverbend Dr
- 6344 Riverbend Dr
- 1489 Scenic River Dr
- 1441 Scenic River Dr
- 1468 Scenic River Dr
- 1460 Scenic River Dr
- 1476 Scenic River Dr