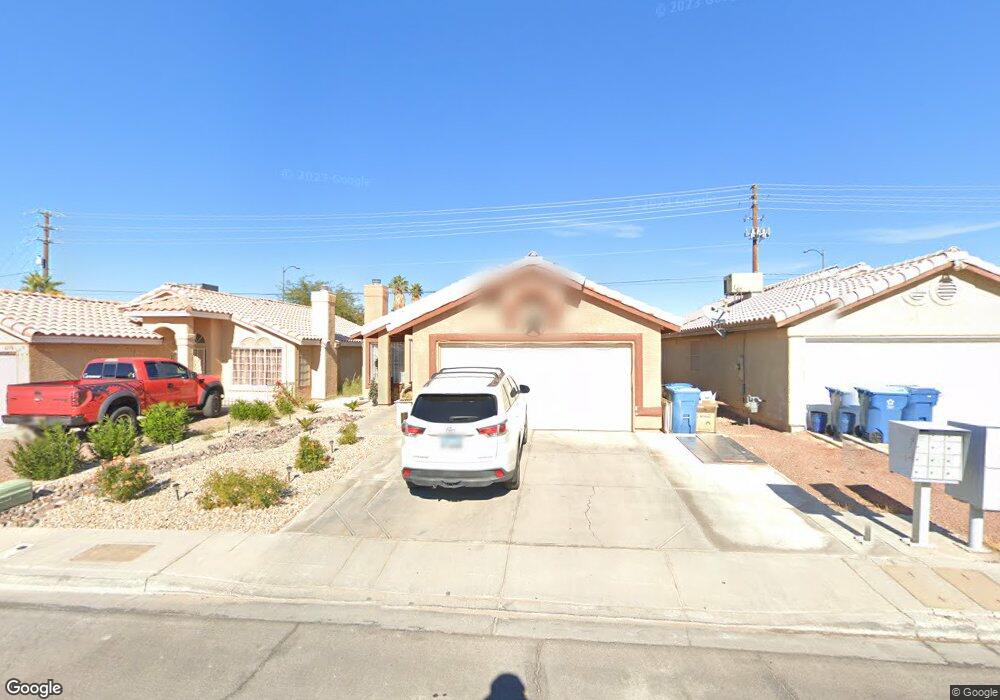
6376 Cranberry Ln Las Vegas, NV 89156
Estimated Value: $307,000 - $358,000
3
Beds
2
Baths
1,230
Sq Ft
$275/Sq Ft
Est. Value
About This Home
This home is located at 6376 Cranberry Ln, Las Vegas, NV 89156 and is currently estimated at $338,084, approximately $274 per square foot. 6376 Cranberry Ln is a home located in Clark County with nearby schools including Helen Herr Elementary School, Dr. William H. Bailey Middle School, and Sunrise Mountain High School.
Ownership History
Date
Name
Owned For
Owner Type
Purchase Details
Closed on
May 6, 2002
Sold by
Hud
Bought by
Zendejas Noe
Current Estimated Value
Home Financials for this Owner
Home Financials are based on the most recent Mortgage that was taken out on this home.
Original Mortgage
$106,626
Outstanding Balance
$45,657
Interest Rate
7.13%
Mortgage Type
FHA
Estimated Equity
$292,427
Purchase Details
Closed on
Jan 16, 2002
Sold by
Citimortgage Inc
Bought by
Hud
Purchase Details
Closed on
Nov 27, 2001
Sold by
Jefferson Angelina R
Bought by
Citimortgage Inc
Purchase Details
Closed on
May 15, 2001
Sold by
Jefferson Angelina R
Bought by
Mortgage Electronic Registration Systems
Purchase Details
Closed on
Jan 29, 1998
Sold by
Norton Chris Lee and Norton Kathryn Colleen
Bought by
Countrywide Home Loans Inc
Purchase Details
Closed on
Jan 23, 1998
Sold by
Countrywide Home Loans Inc
Bought by
Hud
Create a Home Valuation Report for This Property
The Home Valuation Report is an in-depth analysis detailing your home's value as well as a comparison with similar homes in the area
Home Values in the Area
Average Home Value in this Area
Purchase History
| Date | Buyer | Sale Price | Title Company |
|---|---|---|---|
| Zendejas Noe | $108,300 | First American Title Co | |
| Hud | $109,909 | Fidelity National Title | |
| Citimortgage Inc | $109,909 | Fidelity National Title | |
| Mortgage Electronic Registration Systems | $109,909 | Fidelity National Title | |
| Countrywide Home Loans Inc | $91,440 | Nevada Title Company | |
| Hud | -- | Nevada Title Company |
Source: Public Records
Mortgage History
| Date | Status | Borrower | Loan Amount |
|---|---|---|---|
| Open | Zendejas Noe | $106,626 |
Source: Public Records
Tax History Compared to Growth
Tax History
| Year | Tax Paid | Tax Assessment Tax Assessment Total Assessment is a certain percentage of the fair market value that is determined by local assessors to be the total taxable value of land and additions on the property. | Land | Improvement |
|---|---|---|---|---|
| 2025 | $1,074 | $68,515 | $26,250 | $42,265 |
| 2024 | $995 | $68,515 | $26,250 | $42,265 |
| 2023 | $995 | $66,638 | $26,250 | $40,388 |
| 2022 | $922 | $59,402 | $22,400 | $37,002 |
| 2021 | $854 | $54,567 | $19,250 | $35,317 |
| 2020 | $790 | $54,392 | $19,250 | $35,142 |
| 2019 | $740 | $52,296 | $17,500 | $34,796 |
| 2018 | $706 | $45,456 | $11,900 | $33,556 |
| 2017 | $1,326 | $45,225 | $11,200 | $34,025 |
| 2016 | $663 | $40,041 | $8,400 | $31,641 |
| 2015 | $660 | $29,775 | $4,900 | $24,875 |
| 2014 | $641 | $21,192 | $4,900 | $16,292 |
Source: Public Records
Map
Nearby Homes
- 6375 Horizon Ridge Ct
- 6346 Gold Canyon Dr
- 6374 Horizon Ridge Ct
- 6412 Dallaswood Ln
- 2289 Black Bush Ln
- 6255 Bryce Canyon Ave
- 2442 Shatz St
- 6155 Bryce Canyon Ave
- 6560 Bush Clover Ln
- 6304 Mount Rainier Ave
- 6266 Bluehurst Ave
- 6271 E Great Smoky Ave
- 5994 Rocky Mountain Ave
- 2087 Arivada Ferry Ct Unit 101
- 6061 Judson Ave
- 2093 Scanlon Ferry Ct Unit 103
- 6080 E Great Smoky Ave
- 6081 Mount Mckinley Ave
- 2257 Bridle Wreath Ln
- 6071 Big Bend Ave
- 6370 Cranberry Ln
- 6382 Cranberry Ln
- 6388 Cranberry Ln
- 6364 Cranberry Ln
- 6358 Cranberry Ln
- 6394 Cranberry Ln
- 6022 E Carey Ave
- 6232 E Carey Ave Unit 5A
- 5642 E Carey Ave
- 6375 Cranberry Ln
- 6369 Cranberry Ln
- 6352 Cranberry Ln
- 6385 Cranberry Ln
- 6363 Cranberry Ln
- 6395 Cranberry Ln
- 6395 Horizon Ridge Ct
- 6357 Cranberry Ln
- 6346 Cranberry Ln
- 2375 Grove Leaf St
- 2408 Color Canyon Way Unit n/a