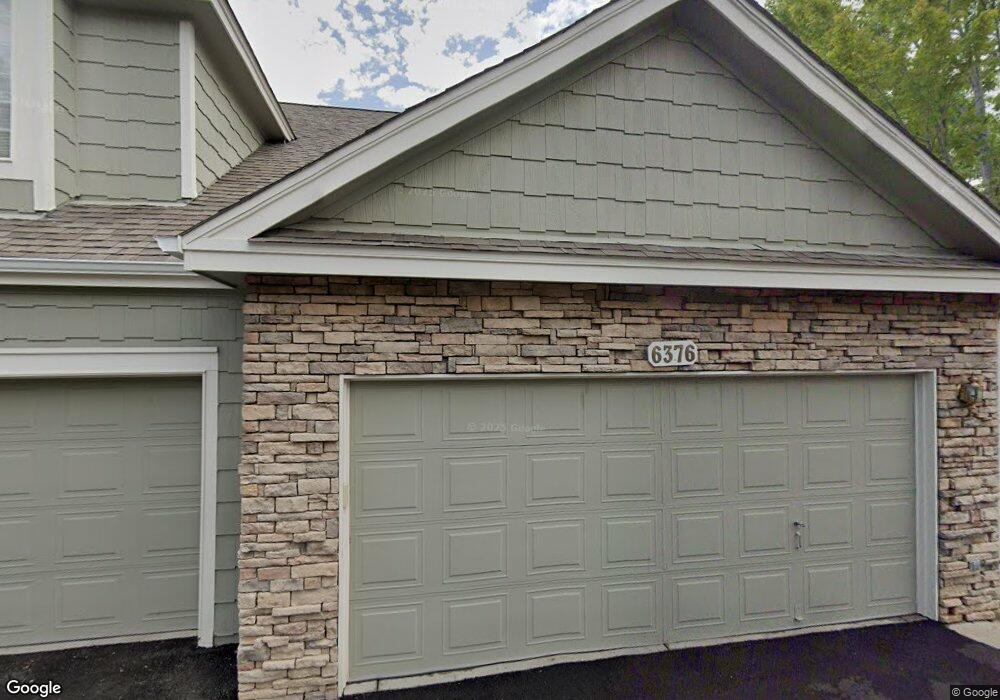
6376 Deframe Way Arvada, CO 80004
Ralston Valley NeighborhoodEstimated Value: $500,000 - $622,000
2
Beds
3
Baths
1,839
Sq Ft
$305/Sq Ft
Est. Value
About This Home
This home is located at 6376 Deframe Way, Arvada, CO 80004 and is currently estimated at $561,168, approximately $305 per square foot. 6376 Deframe Way is a home located in Jefferson County with nearby schools including Fremont Elementary School, Drake Junior High School, and Arvada West High School.
Ownership History
Date
Name
Owned For
Owner Type
Purchase Details
Closed on
Apr 26, 2011
Sold by
Roth John P and Roth Maria J
Bought by
Moe Beverly J
Current Estimated Value
Home Financials for this Owner
Home Financials are based on the most recent Mortgage that was taken out on this home.
Original Mortgage
$228,000
Outstanding Balance
$156,880
Interest Rate
4.82%
Mortgage Type
New Conventional
Estimated Equity
$404,288
Purchase Details
Closed on
Apr 15, 2009
Sold by
Roth John P
Bought by
Roth John P and Roth Maria J
Purchase Details
Closed on
Jul 22, 2004
Sold by
Dominick Shirlee E
Bought by
Roth John P
Home Financials for this Owner
Home Financials are based on the most recent Mortgage that was taken out on this home.
Original Mortgage
$175,000
Interest Rate
6.32%
Mortgage Type
Purchase Money Mortgage
Purchase Details
Closed on
Jun 29, 1998
Sold by
Village Homes Of Colorado Inc
Bought by
Dominick Shirlee E
Create a Home Valuation Report for This Property
The Home Valuation Report is an in-depth analysis detailing your home's value as well as a comparison with similar homes in the area
Home Values in the Area
Average Home Value in this Area
Purchase History
| Date | Buyer | Sale Price | Title Company |
|---|---|---|---|
| Moe Beverly J | $240,000 | None Available | |
| Roth John P | -- | None Available | |
| Roth John P | $225,000 | Fahtco | |
| Dominick Shirlee E | $165,000 | Land Title |
Source: Public Records
Mortgage History
| Date | Status | Borrower | Loan Amount |
|---|---|---|---|
| Open | Moe Beverly J | $228,000 | |
| Previous Owner | Roth John P | $175,000 |
Source: Public Records
Tax History
| Year | Tax Paid | Tax Assessment Tax Assessment Total Assessment is a certain percentage of the fair market value that is determined by local assessors to be the total taxable value of land and additions on the property. | Land | Improvement |
|---|---|---|---|---|
| 2024 | $1,992 | $27,240 | $7,555 | $19,685 |
| 2023 | $1,992 | $27,240 | $7,555 | $19,685 |
| 2022 | $1,565 | $22,927 | $3,643 | $19,284 |
| 2021 | $2,282 | $23,587 | $3,748 | $19,839 |
| 2020 | $2,366 | $24,519 | $6,349 | $18,170 |
| 2019 | $2,334 | $24,519 | $6,349 | $18,170 |
| 2018 | $2,078 | $21,219 | $3,890 | $17,329 |
| 2017 | $1,902 | $21,219 | $3,890 | $17,329 |
| 2016 | $1,978 | $20,791 | $4,974 | $15,817 |
| 2015 | $2,003 | $20,791 | $4,974 | $15,817 |
| 2014 | $2,003 | $19,781 | $4,012 | $15,769 |
Source: Public Records
Map
Nearby Homes
- 6304 Deframe Way
- 6369 Cole Ln
- 13812 W 64th Place
- 13509 W 62nd Dr
- 6329 Braun Cir
- 13750 W 65th Ave
- 13571 W 61st Ln
- 6262 Braun Cir
- 13275 W 63rd Place
- 13352 W 65th Place
- 13334 W 65th Dr
- 13294 W 65th Dr
- 13155 W 63rd Place
- 6069 Zinnia St
- 6658 Cole Ct
- 12995 W 63rd Place Unit A
- 6725 Beech Ct
- 12321 W 58th Dr
- 6053 Youngfield St
- 6762 Beech Dr
- 6378 Deframe Way
- 6372 Deframe Way
- 6388 Deframe Way
- 6375 Deframe Way
- 6377 Deframe Way
- 6370 Deframe Way
- 6390 Deframe Way
- 6373 Deframe Way
- 6379 Deframe Way
- 6371 Deframe Way
- 6368 Deframe Way
- 6381 Deframe Way
- 6392 Deframe Way
- 6366 Deframe Way
- 6383 Deframe Way
- 6342 Deframe Way
- 6369 Deframe Way
- 6344 Deframe Way
- 6394 Deframe Way
- 6387 Deframe Way
Your Personal Tour Guide
Ask me questions while you tour the home.